SmartICS: Reporting Module
Summary
TLDRThis video provides a comprehensive guide to using the Smart ICS Designer Reports module. It walks through logging into Smart ICS, navigating the reports module, creating report templates, and connecting the database. It also explains how to insert variables, add charts and graphs, set up SQL queries, and customize reports with various elements like text, images, and tables. Additionally, viewers learn how to relate data sources, apply filters, and use advanced features like bands and dynamic charts to build detailed, interactive reports. The video aims to help users create customized, data-driven reports efficiently.
Takeaways
- 😀 To access the Smart ICS Designer Reports Module, log in and click the 'Reports' tab in the menu bar.
- 😀 The 'Home' tab allows you to edit elements, change positions, and style the report.
- 😀 The 'Insert' tab lets you add different elements to your report.
- 😀 The 'Page' tab enables customization of page size, orientation, number of columns, and layout.
- 😀 The 'Preview' tab allows for viewing, printing, and exporting reports.
- 😀 To create a report template, use the 'New' button to create a file, then add headings, diagrams, and other elements.
- 😀 Smart ICS Designer works with database data and requires connecting a database to retrieve data from devices.
- 😀 To add a database connection, click the 'Dictionary' tab, select 'New Data Source,' and choose your desired connection.
- 😀 Reports can display data from the MSSQL database, such as device IDs, item IDs, timestamps, and values.
- 😀 Variables, like 'start time' and 'end time,' can be used to filter data in the reports, allowing for dynamic reports based on user input.
- 😀 Graphs and charts can be added and customized in the report to visualize data, including adding bands to the chart for correct display.
- 😀 The report can include various components such as text, images, checkboxes, sub-reports, and more for enhanced functionality and display.
Q & A
What is the Smart ICS Designer Reports module used for?
-The Smart ICS Designer Reports module is used to create, manage, and export report templates by retrieving data from connected databases, allowing users to customize the layout, data elements, and design of their reports.
How do you access the Reports module in Smart ICS?
-To access the Reports module, log in to the Smart ICS main page, then find and click the 'Reports' tab in the menu bar.
What can you do in the 'Home' tab of the Reports module?
-In the 'Home' tab, you can edit report elements, change their position, and adjust their style.
What is the function of the 'Insert' tab in the Reports module?
-The 'Insert' tab allows you to add different elements to the report template, such as headings, diagrams, and data components.
How can you create a new report template in the Smart ICS Reports module?
-To create a new report template, click the 'Menu' button, select 'New,' enter a file name for the template, and click 'OK.' Once created, the template will appear as an empty report ready for customization.
What is required to retrieve data for reports in Smart ICS?
-Smart ICS requires a connection to a database to retrieve data. You can connect the database by selecting 'New Data Source' under the 'Dictionary' tab and configuring the connection to fetch the data from the selected table.
How do you link device names and parameters to the report?
-To link device names and parameters, you must use the 'Smart ICS Devices' and 'Smart ICS Parameters' data sources in the 'Dictionary' tab, retrieving columns and creating relations between the tables.
What role do variables play in the Smart ICS Reports module?
-Variables allow you to set dynamic values like start and end times for your report. These variables can be configured in the 'Dictionary' tab and can be adjusted by the user when generating the report.
How do you include graphs or charts in your report template?
-To add a chart to the report, use the 'Insert' tab, select a chart type (e.g., clustered column), and configure the necessary parameters, series, and data values. Charts can be customized with advanced settings in the properties panel.
What is the difference between 'Standard Bands' and 'Cross Bands' in the report design?
-Standard Bands are basic elements for building reports, while Cross Bands are more complex and cannot be placed on a page, allowing for the creation of cross-sectional reports with multiple data sources.
Outlines

This section is available to paid users only. Please upgrade to access this part.
Upgrade NowMindmap

This section is available to paid users only. Please upgrade to access this part.
Upgrade NowKeywords

This section is available to paid users only. Please upgrade to access this part.
Upgrade NowHighlights

This section is available to paid users only. Please upgrade to access this part.
Upgrade NowTranscripts

This section is available to paid users only. Please upgrade to access this part.
Upgrade NowBrowse More Related Video

OrangeHRM HR Administrators User Manual for Version 5.7.0.1

48 Minutes of Clever Make.com Hacks That Save You Time & Money
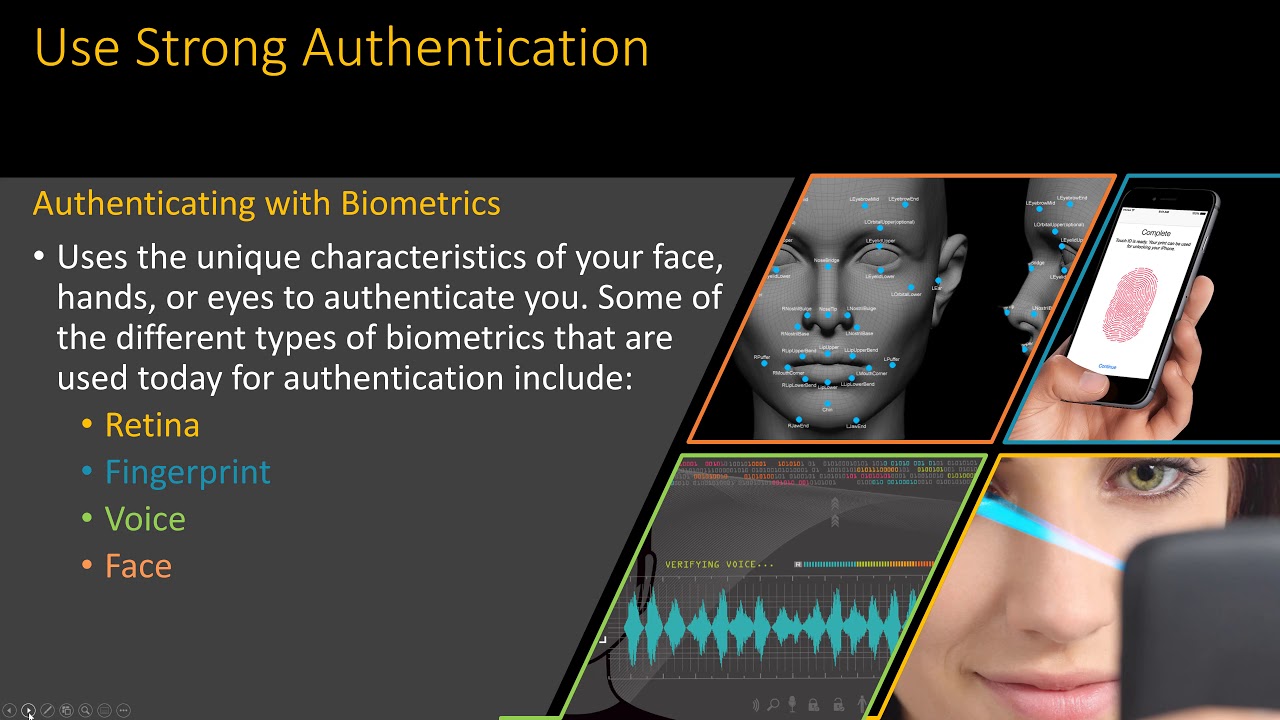
Computer Concepts - Module 6: Security and Safety Part 2B (4K)
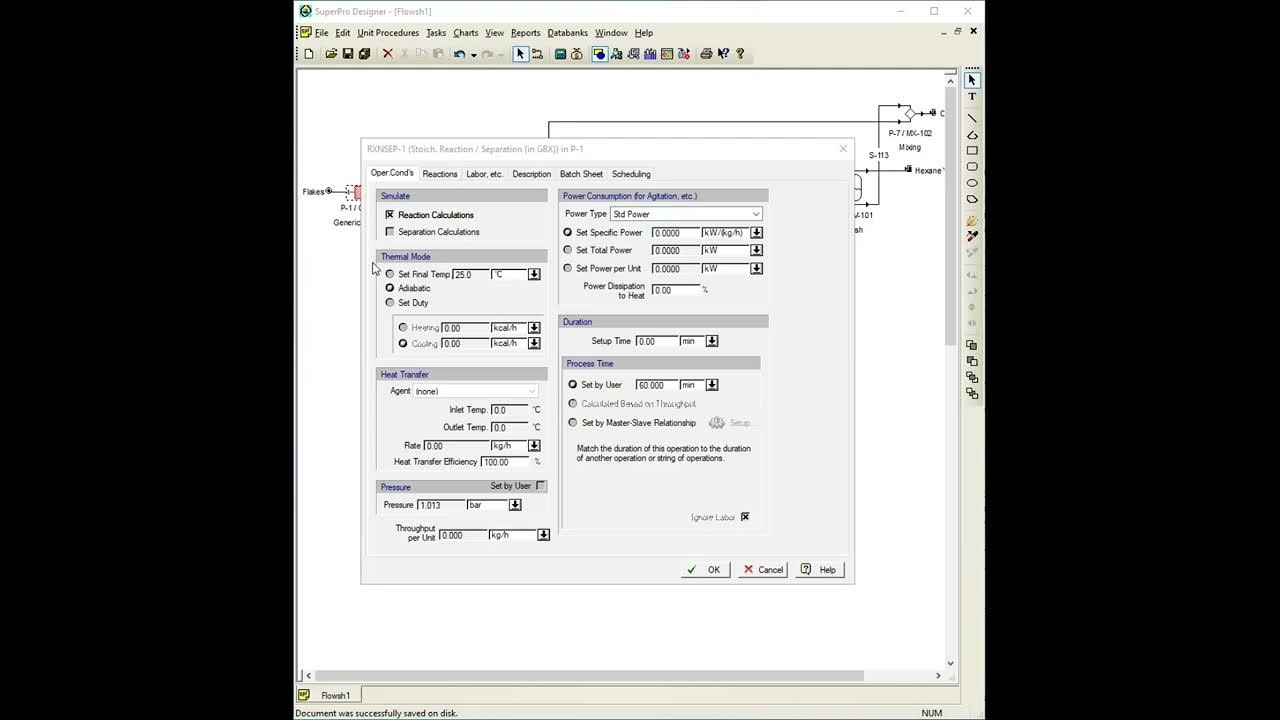
Extraction on SuperPro Designer

Cara mengubah rumah biasa menjadi smart home

pusat sesaat mekanisme yang memiliki 6 batang penghubung
5.0 / 5 (0 votes)