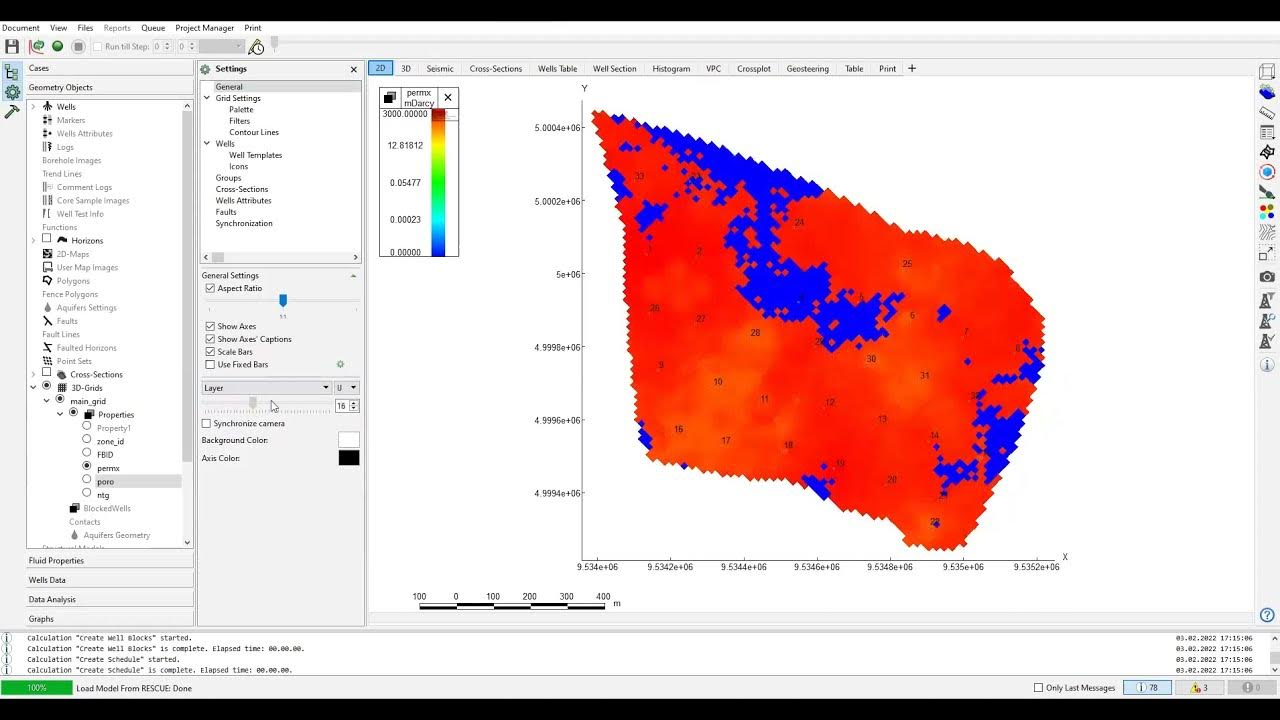
Surpac Tutorials -Lesson 3 Geology database(Drillhole styles and Manipulation)
Summary
TLDRThis video script provides a detailed guide on displaying and manipulating Drew holes in geological software. It covers various methods for displaying hole data, including the use of different tables such as assay and geology. The tutorial explains how to set display styles for different grades and rock types, with an emphasis on visualizing geological and assay information through color coding, line thickness adjustments, and graphical displays like bar graphs and cylinders. It also demonstrates how to manipulate hole data, label key features, and edit values for customized geological analysis.
Takeaways
- 😀 Display drill holes using multiple methods: by clicking icons, selecting from the database menu, or using the shortcut DH.
- 😀 Rescale view to show all drill holes in a plan view, which helps visualize geological data on a 2D map.
- 😀 Uncheck the 'Add Constraint to Hole' box to display all drill holes without applying constraints, making the data more comprehensive.
- 😀 Use tables like Assay, Geology, and others to display specific drill hole data such as gold values and lithology.
- 😀 Set styles for assay data by assigning colors to different gold grade ranges (e.g., white for low, red for high).
- 😀 Geology data is displayed with customized colors and graphic patterns to represent different rock types and geological formations.
- 😀 Redox zones (oxidized and unoxidized states) can be color-coded (e.g., red for completely oxidized, blue for fresh) to represent the state of oxidation in the drill holes.
- 😀 Use cylinder styles with variable width to represent different assay grades visually, with larger cylinders for higher grades.
- 😀 Add labels and graphs, such as displaying maximum depth or assay values, to provide more detailed information about each drill hole.
- 😀 Geology patterns can be displayed at specific offsets from the drill hole trace, with each rock type having its distinct pattern for clarity in visualization.
Q & A
How can you display the Drew Hol in the system?
-You can display the Drew Hol by going to the database in the status area and clicking on 'Display Drew Hol'. Alternatively, you can click the 'Display Drew Hol' icon, select 'Display' from the database menu, or use the shortcut 'DH' and press 'Enter' to bring up the form.
What is the significance of the 'Rescale View' checkbox?
-The 'Rescale View' checkbox, when checked, ensures that the drill holes will be displayed in a plan view. It helps maintain the correct scale when visualizing the holes on the graphical interface.
Why would you uncheck the 'Add Constraint to Hole' box?
-You would uncheck the 'Add Constraint to Hole' box when you do not want to apply any constraints to the display of the Drew Hol. Leaving it unchecked allows for displaying all drill holes without applying specific constraints.
What are the different tabs used for displaying Drew Hol?
-There are several tabs used to display Drew Hol, including 'Assay', 'Geology', and 'Label'. Each tab allows you to display different data such as assay values, geological formations, and labeling for metadata like lithology or rock types.
What does the 'Color' section in the 'Assay' tab represent?
-The 'Color' section in the 'Assay' tab represents the starting point of the Drew Hol and is used to visually indicate assay values. It can show the maximum depth of the hole and is important for distinguishing between different grades of minerals along the hole.
What is the purpose of the 'Graphics Color' and 'Plotting Color'?
-The 'Graphics Color' refers to the color displayed in the graphical view of the drill holes, while the 'Plotting Color' refers to the color used when preparing the data for printing or plotting. These help differentiate between visual representation and printed data outputs.
How do you set the cutoff for gold values in the system?
-To set the cutoff for gold values, right-click on the gold value field in the 'Assay' tab and select 'Get Minimum and Maximum Range'. This will load the values from the database. You can then manually enter your own cutoff values and apply a style based on these ranges.
What is the purpose of using different colors for the gold value categories?
-Using different colors for gold value categories helps visually differentiate between various ranges of gold grades. For example, values between 0 and 0.2 can be represented in white, while higher grades, such as 5 to 999, are represented in magenta. This makes it easier to interpret assay results.
How do you increase the visibility of drill hole traces in the graphical view?
-To increase the visibility of drill hole traces, you can change the line thickness. This can be done by selecting the line and adjusting the thickness in the properties section. A thicker line makes it easier to view the traces on the graphical interface.
What customization options are available for displaying geological patterns?
-You can customize geological patterns by setting the 'Offset' distance from the drill hole trace and choosing the 'Position' of the pattern (e.g., right or left of the trace). You can also assign specific colors and patterns to different lithologies, such as using lavender for one type of rock and red for another.
Outlines

This section is available to paid users only. Please upgrade to access this part.
Upgrade NowMindmap

This section is available to paid users only. Please upgrade to access this part.
Upgrade NowKeywords

This section is available to paid users only. Please upgrade to access this part.
Upgrade NowHighlights

This section is available to paid users only. Please upgrade to access this part.
Upgrade NowTranscripts

This section is available to paid users only. Please upgrade to access this part.
Upgrade Now5.0 / 5 (0 votes)


