Tutorial Diagrammi di Bode lezione #1: introduzione, cosa sono e a cosa servono
Summary
TLDRThe video script introduces the concept of Bode diagrams, which are graphical representations of a system's transfer function as it varies with frequency. These diagrams are crucial for studying the behavior of systems, particularly in the audio field, where understanding amplification and the quality of amplifiers is essential. Bode diagrams consist of two parts: one for the amplitude (in decibels) and one for the phase, both plotted against the logarithmic frequency scale. The script explains that these diagrams are drawn on semi-logarithmic paper or using pre-printed graph paper, with the y-axis representing the transfer function in decibels. The use of logarithmic scales allows for a clear visualization of system behavior over a wide range of frequencies, making it easier to understand and analyze. The video aims to provide a step-by-step guide on how to create and interpret Bode diagrams, emphasizing their importance in studying the stability of systems.
Takeaways
- 📈 The Bode diagrams are graphical representations of a system's transfer function as it varies with frequency or pulsation.
- 🎛️ They are used to study the behavior of a system in a sinusoidal regime by examining the system's amplitude and phase.
- 📊 Bode diagrams consist of two parts: a magnitude plot (in dB) and a phase plot, both as a function of frequency.
- 📚 The diagrams are typically drawn on semi-logarithmic paper, with the frequency axis on a logarithmic scale and the magnitude on a linear scale in decibels.
- 🔍 The logarithmic scale allows for the representation of a wide range of frequencies, from very low to very high, on the same graph.
- 📏 A 'decade' on the logarithmic scale refers to the space between one power of 10 and the next, which is a constant distance on the graph.
- 📉 The magnitude plot shows how the gain of the system changes in dB as frequency increases, which is crucial for analyzing systems like amplifiers in the audio field.
- 🔄 The phase plot indicates the phase shift of the output signal relative to the input signal at different frequencies.
- 🎛️ Bode diagrams are essential for understanding how a system's response changes with frequency, which is vital for system design and stability analysis.
- 📐 The process of creating Bode diagrams involves step-by-step instructions to ensure accuracy and clarity in representation.
- 📈 By using the properties of logarithms, Bode diagrams simplify the visualization and analysis of a system's behavior over a range of frequencies.
Q & A
What are Bode diagrams used for?
-Bode diagrams are used to graphically represent the transfer function of a system as its frequency varies. They are particularly useful for studying the behavior of a system in a sinusoidal steady state.
What are the two main components of a Bode diagram?
-The two main components of a Bode diagram are the Bode plot of the magnitude (in dB) and the Bode plot of the phase (in degrees), both as a function of frequency.
How is the frequency axis represented in a Bode diagram?
-The frequency axis in a Bode diagram is represented on a logarithmic scale, which allows for a wide range of frequencies to be displayed without the graph becoming too crowded.
What is the significance of a 'decade' on a logarithmic scale?
-A decade on a logarithmic scale refers to the space between one power of 10 and the next. It is a measure of the frequency range and is used to describe the spacing between different frequency points on the logarithmic axis.
How is the magnitude represented in a Bode diagram?
-The magnitude is represented in a Bode diagram using a linear scale in decibels (dB). This allows for a clear visualization of the system's gain or loss as frequency changes.
What is the purpose of using a semi-logarithmic scale in Bode diagrams?
-A semi-logarithmic scale is used in Bode diagrams to effectively display the system's behavior over several orders of magnitude in frequency without the need for an excessively large or small scale.
Why is the phase plot important in Bode diagrams?
-The phase plot is important because it shows how the phase of the system's output signal changes with frequency, which is crucial for understanding the system's stability and time-domain behavior.
How do Bode diagrams help in the field of audio?
-In the field of audio, Bode diagrams help in studying the amplification and quality of amplifiers by examining how they perform as the frequency varies.
What is the process of creating a Bode diagram?
-Creating a Bode diagram involves plotting the magnitude and phase of a system's transfer function on a semi-logarithmic scale, following specific graphical rules that will be explained step by step in further tutorials.
What are the advantages of using pre-printed graph paper for Bode diagrams?
-Pre-printed graph paper with a logarithmic scale for the frequency axis and a linear scale in decibels for the magnitude simplifies the process of drawing Bode diagrams and makes it more convenient.
Why is it important to understand Bode diagrams in the study of system stability?
-Understanding Bode diagrams is important for the study of system stability because they provide a graphical representation of how a system responds to sinusoidal inputs at different frequencies, which is key to analyzing and predicting the system's behavior.
What is the next step after understanding the basics of Bode diagrams?
-After understanding the basics, the next step is to learn how to draw Bode diagrams step by step, starting with the introduction of the logarithmic scale and moving on to the specifics of plotting the magnitude and phase on the graph.
Outlines

This section is available to paid users only. Please upgrade to access this part.
Upgrade NowMindmap

This section is available to paid users only. Please upgrade to access this part.
Upgrade NowKeywords

This section is available to paid users only. Please upgrade to access this part.
Upgrade NowHighlights

This section is available to paid users only. Please upgrade to access this part.
Upgrade NowTranscripts

This section is available to paid users only. Please upgrade to access this part.
Upgrade NowBrowse More Related Video

What are Transfer Functions? | Control Systems in Practice
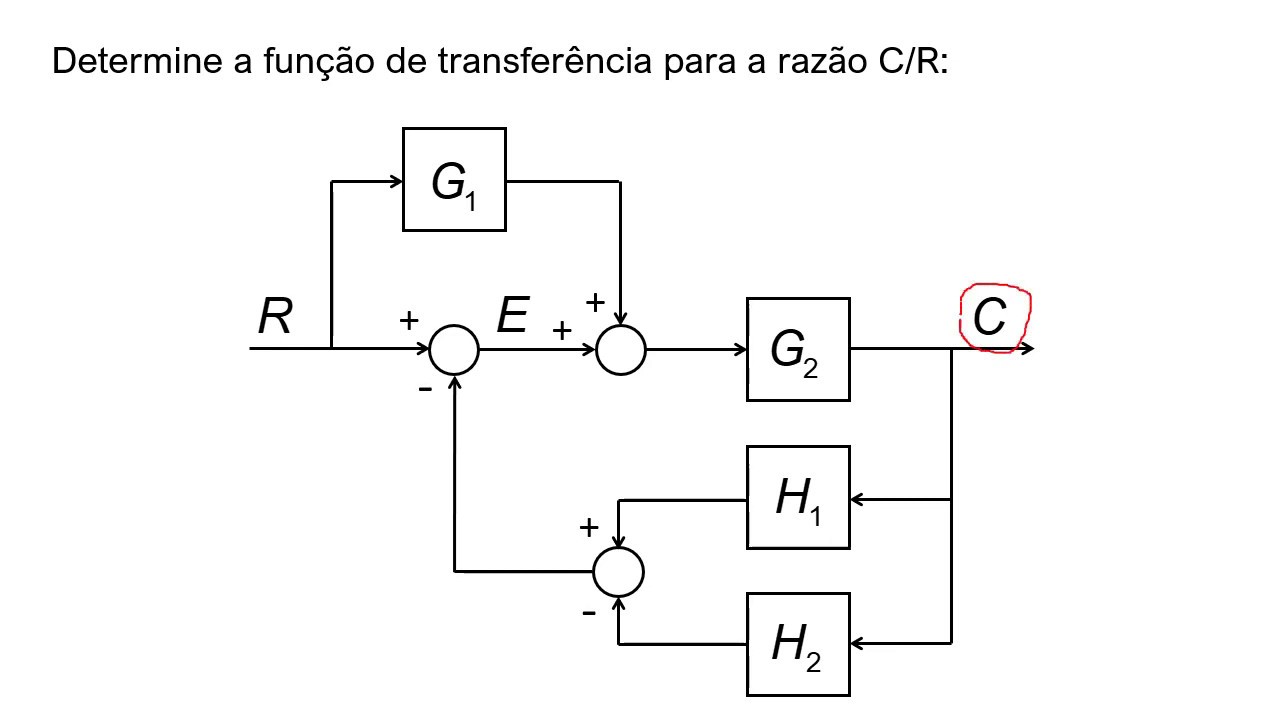
Diagramas de blocos e sua álgebra

Control System Lectures - Bode Plots, Introduction

Frequency response Part 1
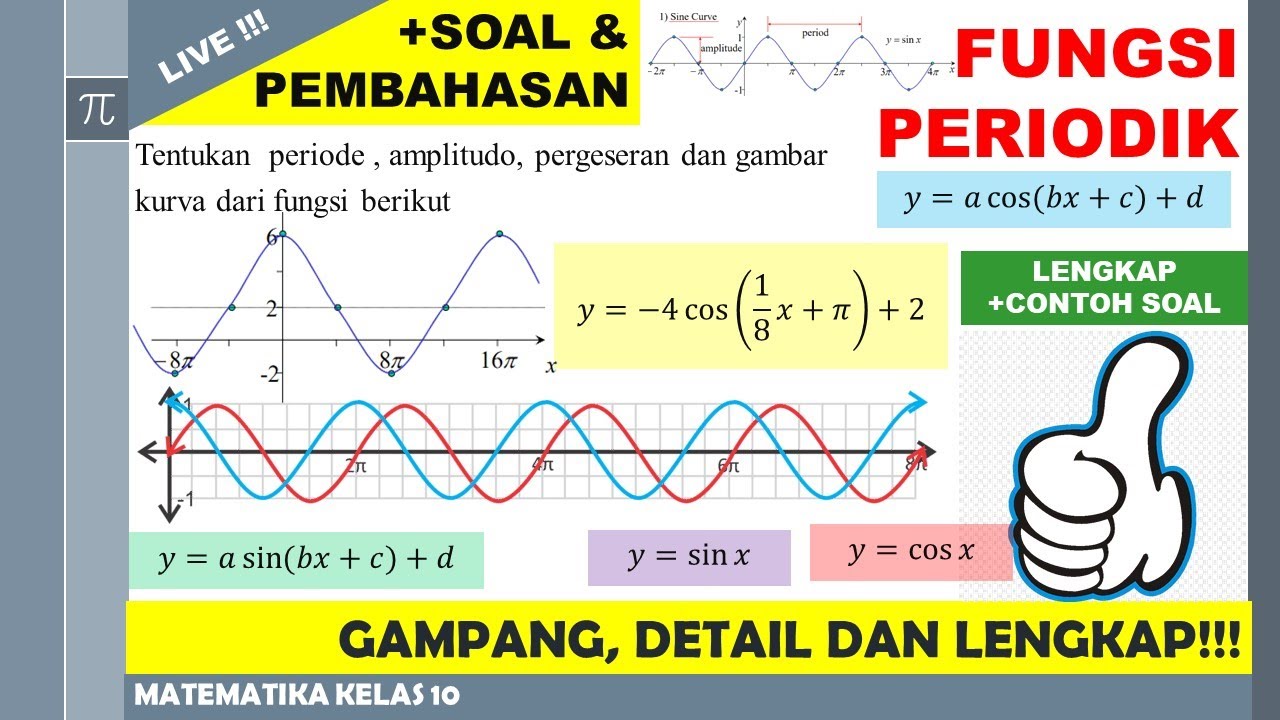
Fungsi 12: Fungsi Periodik dan Grafik Fungsi Trigonometri Kelas 10

Electric field strength Lesson on Edexcel IAL Unit 4 WPH14/01 A Level Physics Coulomb's law IB
5.0 / 5 (0 votes)