Analisis Indeks Kemerataan spesies - Indeks Dominansi spesies - Indeks Kekayaan spesies
Summary
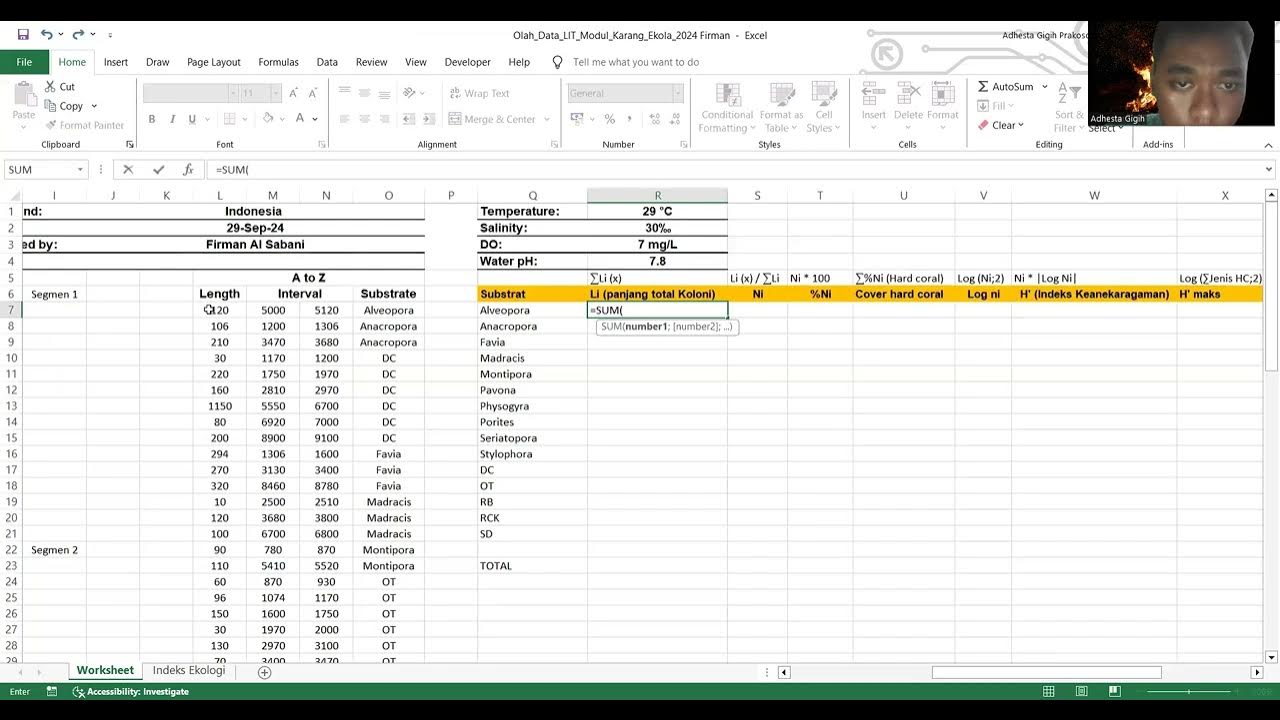
TLDRThis tutorial provides a comprehensive guide to calculating key ecological diversity indices, including the Evenness Index, Dominance Index, and Species Richness Index. The video walks through formulas for each index and their significance in analyzing biodiversity in a research area. The Evenness Index indicates stable species distribution, the Dominance Index reveals the extent of species dominance, and the Species Richness Index measures overall species diversity. With practical examples, the tutorial helps viewers understand how to interpret these indices for assessing ecological health.
Takeaways
- 😀 The script explains how to calculate the Shannon Diversity Index (H') using a formula involving the total species count and the relative abundance of each species.
- 😀 The value of H' is interpreted as an indicator of species evenness. A value below 0.2 suggests instability, while values between 0.2 and 1 indicate stable species evenness.
- 😀 The script highlights that the calculated value of H' for amphibians and reptiles in the study area is 0.95, which means the species evenness is stable.
- 😀 The Dominance Index (D) is calculated using the sum of squared proportions (pi) for each species, with the formula Σ(pi²).
- 😀 The Dominance Index value of 0.09 indicates low species dominance in the study area, as the value is below 0.5.
- 😀 Species dominance is categorized into three levels: low (0-0.5), medium (0.5-0.75), and high (0.75-1).
- 😀 The script mentions that the Dominance Index for the study area is 0.09, indicating low species dominance.
- 😀 The script also covers how to calculate the Species Richness Index using the formula (S - 1) / ln(N), where S is the species count and N is the total number of individuals.
- 😀 The calculated Species Richness Index is 3.26, suggesting moderate species richness in the study area.
- 😀 The tutorial provides step-by-step instructions on using spreadsheet functions like SUM and auto-sum to calculate these indices.
- 😀 The video ends with a call to action, encouraging viewers to like, subscribe, and comment if they have further questions.
Q & A
What is the formula for calculating the species diversity index (S)?
-The formula for the species diversity index (S) is: S = haksen / haksen_max, where 'haksen' is the value of the diversity index, and 'haksen_max' is the maximum possible value, which depends on the total number of species.
What does the 'haksen' value represent in this context?
-'Haksen' refers to the value of the species diversity index for the study location, calculated as the logarithmic ratio of the observed species to the total species.
What does an 'index of evenness' of 0.95 indicate?
-An index of evenness value of 0.95 indicates a stable distribution of species, specifically for amphibians and reptiles in the study area, as values between 0.2 and 1 indicate stable species evenness.
How is the index of evenness calculated?
-The index of evenness is calculated using the formula: evenness index = Winner / (LN(total species count)), where 'Winner' is the diversity index value and 'LN' represents the natural logarithm of the total species count.
What does a value of 0.09 for the dominance index imply?
-A dominance index value of 0.09 suggests low dominance of species in the research area, as dominance values below 0.5 indicate low dominance.
What is the significance of the dominance index?
-The dominance index measures how evenly the individuals of different species are distributed in the ecosystem. A low dominance index means that no single species overwhelmingly dominates the area.
What are the possible interpretations of dominance index values?
-Dominance index values are interpreted as follows: values between 0 and 0.5 indicate low dominance, values between 0.5 and 0.75 indicate moderate dominance, and values between 0.75 and 1 indicate high dominance.
How is the species richness index calculated?
-The species richness index (Rp) is calculated with the formula: Rp = (S - 1) / LN(N), where 'S' is the number of species, and 'N' is the total number of individuals in the study.
What does a species richness index of 3.26 mean?
-A species richness index of 3.26 suggests a moderately rich species community, with a higher number of species relative to the total number of individuals in the study area.
What does a value of 0.2 for species evenness suggest?
-A value of 0.2 for species evenness suggests that the species distribution is not stable, with one or more species possibly being dominant in the area, resulting in an uneven distribution.
Outlines

This section is available to paid users only. Please upgrade to access this part.
Upgrade NowMindmap

This section is available to paid users only. Please upgrade to access this part.
Upgrade NowKeywords

This section is available to paid users only. Please upgrade to access this part.
Upgrade NowHighlights

This section is available to paid users only. Please upgrade to access this part.
Upgrade NowTranscripts

This section is available to paid users only. Please upgrade to access this part.
Upgrade Now5.0 / 5 (0 votes)


