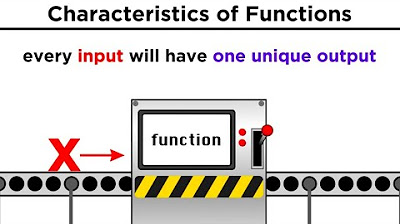
Edpuzzle Originals - Absolute Value Parent Function
Summary
TLDRThis video introduces the absolute value parent function, explaining its relationship between input and output. The function outputs positive values, reflecting the distance from zero, resulting in a V-shaped graph. Key features discussed include the axis of symmetry, the vertex at (0,0), and both the X and Y intercepts also at the origin. The domain encompasses all real numbers, while the range consists of non-negative values. Understanding these characteristics helps viewers grasp the similarities among functions in the absolute value family, enhancing their mathematical knowledge.
Takeaways
- 😀 The absolute value function represents relationships between inputs (X values) and outputs (Y values).
- 😀 The absolute value function is the parent function for a family of similar functions.
- 😀 The output of the absolute value function is always positive, reflecting the distance from zero.
- 😀 The graph of the absolute value function forms a V-shape, with key points such as (-2, 2), (-1, 1), (0, 0), (1, 1), and (2, 2).
- 😀 The absolute value function has a vertical line of symmetry at the Y-axis (x = 0).
- 😀 The vertex of the graph, where it changes direction, is at the point (0, 0), which is also the minimum point.
- 😀 The X-intercept of the graph occurs at the origin (0, 0).
- 😀 The Y-intercept also occurs at the origin (0, 0).
- 😀 The domain of the absolute value function includes all real numbers from negative infinity to positive infinity.
- 😀 The range of the function includes all Y values greater than or equal to zero, as negative outputs are not possible.
Q & A
What is the main concept discussed in the video?
-The video discusses the absolute value function, explaining its characteristics and how it relates to inputs and outputs.
What does 'f of x' represent in the context of the absolute value function?
-'f of x' represents the output of the function for a given input 'x', specifically the absolute value of that input.
How is the absolute value function represented graphically?
-The absolute value function is represented as a V-shaped graph, which reflects its characteristic of returning positive outputs.
What is the significance of the vertex in the absolute value function?
-The vertex is the lowest point of the graph for the absolute value function, located at (0, 0), where the graph changes direction.
What is the axis of symmetry for the absolute value function?
-The axis of symmetry for the absolute value function is the vertical line x = 0, which divides the graph into two mirror-image halves.
What are the x and y intercepts of the absolute value function?
-Both the x and y intercepts of the absolute value function occur at the origin (0, 0).
What does the domain of the absolute value function consist of?
-The domain of the absolute value function includes all real numbers, represented as negative infinity to positive infinity.
What is the range of the absolute value function?
-The range of the absolute value function consists of all y values that are greater than or equal to zero.
How can the key features of the absolute value parent function help understand other functions in the family?
-Understanding the key features of the absolute value parent function aids in recognizing how other functions in its family behave, as they may exhibit similar traits even if they are transformed.
What does the term 'absolute value' imply about the outputs of the function?
-The term 'absolute value' implies that the outputs are always non-negative since it measures the distance from zero.
Outlines

This section is available to paid users only. Please upgrade to access this part.
Upgrade NowMindmap

This section is available to paid users only. Please upgrade to access this part.
Upgrade NowKeywords

This section is available to paid users only. Please upgrade to access this part.
Upgrade NowHighlights

This section is available to paid users only. Please upgrade to access this part.
Upgrade NowTranscripts

This section is available to paid users only. Please upgrade to access this part.
Upgrade Now5.0 / 5 (0 votes)


