How To Analyse XRD Data / Plot / Graph in Research Paper? Experimental Paper Skills
Summary
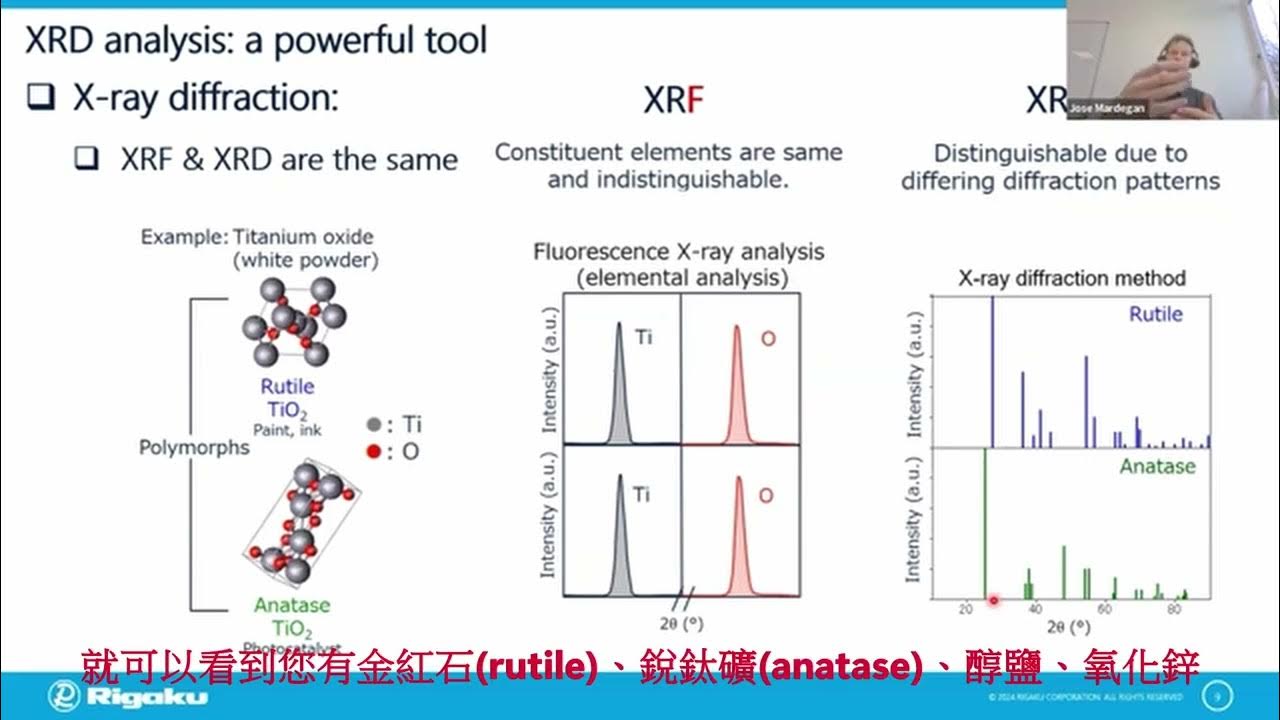
TLDRThe video explains how to interpret X-ray diffraction (XRD) data, a crucial step in materials research. The speaker outlines how XRD helps determine whether a material is crystalline or amorphous, and provides a step-by-step guide on analyzing the intensity vs. 2-theta plots. The discussion includes comparing experimental data with standard references (such as JCPDS cards) to confirm material synthesis, especially for composites. It highlights key XRD parameters like D-spacing, peak width, and intensity, which help assess crystallinity and compositional changes in the material. Future videos will cover these concepts in greater depth.
Takeaways
- 🔍 XRD (X-ray Diffraction) analysis is essential for characterizing materials in research, particularly to determine if a material is crystalline or amorphous.
- 📈 XRD graphs typically plot intensity versus 2-theta angles, with sharp peaks indicating crystalline structures.
- 🧪 Crystalline materials have periodic atomic arrangements, while amorphous materials do not, which affects the peaks on an XRD graph.
- 📊 XRD data can be obtained from machines and exported into files (Word or Excel), allowing for further analysis or custom graph plotting.
- 📝 XRD results are compared with standard reference data (JCPDS or ICSD) to verify if the material matches the expected crystalline structure.
- 🧩 Doping or making composites can cause shifts or changes in XRD peak positions, helping identify alterations in the material's atomic structure.
- ⚛️ The size and arrangement of atoms, like cubic or hexagonal, influence how a material's XRD pattern appears, especially when atoms are substituted or distorted.
- 📋 When writing research papers, XRD data analysis should include crystallinity, peak intensity, and peak width, among other parameters.
- 🔎 XRD provides information about material purity, crystallinity, and whether the synthesized material matches the desired structure.
- 💡 Key XRD parameters include D-spacing, full width at half maximum (FWHM), peak intensity, and peak width, all of which will be explained in future discussions.
Q & A
What is XRD used for in material research?
-XRD (X-ray diffraction) is used to determine whether a material is crystalline or amorphous. It helps analyze the arrangement of atoms in a material, providing insights into its structural properties.
What does a sharp peak in an XRD graph indicate?
-A sharp peak in an XRD graph indicates that the material is crystalline, meaning that its atoms are arranged in a regular, periodic pattern.
How can you tell if a material is amorphous using XRD?
-If the XRD graph shows a broad hump or lacks sharp peaks, it indicates that the material is amorphous, meaning that its atoms are not arranged in a regular order.
What information does the 2-theta angle provide in an XRD graph?
-The 2-theta angle in an XRD graph represents the angle at which X-rays are diffracted by the crystal planes of a material. It is used to determine the spacing between atomic planes (d-spacing) and to identify different phases in the material.
How do researchers verify their XRD results?
-Researchers compare their XRD results with standard data from the JCPDS (Joint Committee on Powder Diffraction Standards) database or ICSD (International Centre for Diffraction Data). Matching peaks indicate that the synthesized material matches the standard reference material.
What can variations in XRD peak positions indicate when working with composite materials?
-Variations in peak positions can indicate changes in the crystal structure due to doping or interstitial atoms, suggesting that the host material's atomic arrangement has been altered. This can confirm the formation of a composite material.
Why might a researcher use Excel for XRD data analysis instead of relying on software-generated graphs?
-Researchers might use Excel to manually plot XRD data if they want to customize their analysis or prefer a different graphical presentation than what is provided by the default software from the XRD machine.
What are the key parameters in XRD data analysis?
-The key parameters in XRD data analysis include the d-spacing, full width at half maximum (FWHM), peak intensity, and peak width. These parameters help to determine crystallinity, crystal size, and phase purity of a material.
What does a shift in 2-theta values suggest about a material?
-A shift in 2-theta values can indicate lattice distortion or changes in the crystal structure, which might occur due to doping, strain, or the formation of a composite material.
How can XRD help determine if a material synthesis was successful?
-By comparing the XRD pattern of the synthesized material with the standard data, researchers can confirm if the synthesized material matches the desired structure. If the patterns match, it indicates successful synthesis; otherwise, it may suggest impurities or incorrect synthesis.
Outlines

This section is available to paid users only. Please upgrade to access this part.
Upgrade NowMindmap

This section is available to paid users only. Please upgrade to access this part.
Upgrade NowKeywords

This section is available to paid users only. Please upgrade to access this part.
Upgrade NowHighlights

This section is available to paid users only. Please upgrade to access this part.
Upgrade NowTranscripts

This section is available to paid users only. Please upgrade to access this part.
Upgrade NowBrowse More Related Video
5.0 / 5 (0 votes)


