The Covariance Matrix : Data Science Basics
Summary
TLDRThis video explains the concept of a covariance matrix in data science, using a simple example involving happiness derived from eating apples and bananas. It describes how to construct a 2x2 covariance matrix, emphasizing the relationships between different variables, including variances and covariances. Key observations include the symmetry of covariance matrices and the similarity between covariance and correlation. The video also walks through calculating the covariance and variance of the variables using basic statistical formulas, illustrating how a covariance matrix helps identify relationships between multiple data points.
Takeaways
- 📊 The covariance matrix is a square matrix filled with covariances between variables in a dataset.
- 🍎🍌 In this example, the variables are happiness derived from eating apples and bananas, with three test subjects providing data.
- 📈 Covariance measures how much two variables go together—if both increase or decrease together, they have positive covariance; if one increases while the other decreases, they have negative covariance.
- 🔗 Covariance is closely related to correlation, but while correlation is bounded between -1 and 1, covariance has no such bounds.
- 🔢 The covariance matrix is square because it includes all variables on both the rows and columns, capturing every pair's covariance.
- ➖ Diagonal elements of the covariance matrix represent the variance of a variable, while off-diagonal elements represent the covariance between two different variables.
- ♻️ The covariance matrix is symmetric, meaning the covariance of A and B is the same as B and A.
- 📐 The covariance between two variables is calculated using the formula: Cov(A, B) = E(A * B) - E(A) * E(B), where E represents the expected value.
- ✏️ The final covariance matrix for the apple and banana example is 2x2, with the variances on the diagonal and covariances on the off-diagonal.
- 🔬 Covariance matrices can become much larger when working with more variables, capturing relationships between each pair of variables.
Q & A
What is a covariance matrix?
-A covariance matrix is a square matrix that contains the covariances between pairs of variables in a dataset. Each element represents the covariance between two variables, with variances on the diagonal and covariances on the off-diagonal.
How is the covariance between two variables defined?
-Covariance between two variables measures the degree to which they change together. If both variables increase or decrease simultaneously, they have positive covariance. If one increases while the other decreases, they have negative covariance.
How is covariance similar to correlation?
-Covariance and correlation both measure the relationship between two variables. The key difference is that correlation is standardized and bounded between -1 and 1, whereas covariance is not bounded and is sensitive to the scale of the variables.
Why is the covariance matrix always square?
-The covariance matrix is square because it compares each variable with every other variable, including itself. The number of rows and columns equals the number of variables in the dataset.
What does it mean that the covariance matrix is symmetric?
-A covariance matrix is symmetric because the covariance between variable A and B is the same as the covariance between variable B and A. The matrix is identical when flipped along its diagonal.
What is variance, and how is it related to covariance?
-Variance is a special case of covariance, where a variable is compared to itself. The variance is found on the diagonal of the covariance matrix, while covariances between different variables are found off-diagonal.
How do you calculate the covariance between two variables?
-Covariance between two variables is calculated as the expected value of the product of the two variables, minus the product of their individual expected values.
How is the variance of a variable calculated using the covariance formula?
-Variance is calculated using the same covariance formula by treating the two variables as identical. It equals the expected value of the squared variable minus the square of the variable's mean.
In the example with apples and bananas, what are the variances and covariances?
-For the apples and bananas example, the variance of the apple variable is 8/3, the variance of the banana variable is 2/3, and the covariance between apples and bananas is 2/3.
What does the covariance matrix tell us in the apple and banana example?
-The covariance matrix shows that there is some positive relationship between happiness derived from eating apples and bananas (covariance of 2/3), with higher variability in happiness from apples (variance of 8/3) than from bananas (variance of 2/3).
Outlines

This section is available to paid users only. Please upgrade to access this part.
Upgrade NowMindmap

This section is available to paid users only. Please upgrade to access this part.
Upgrade NowKeywords

This section is available to paid users only. Please upgrade to access this part.
Upgrade NowHighlights

This section is available to paid users only. Please upgrade to access this part.
Upgrade NowTranscripts

This section is available to paid users only. Please upgrade to access this part.
Upgrade NowBrowse More Related Video
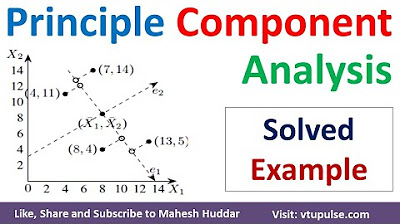
1 Principal Component Analysis | PCA | Dimensionality Reduction in Machine Learning by Mahesh Huddar

Why Do Apples Turn Brown?
Aprenda Matriz Rápido I Matrizes
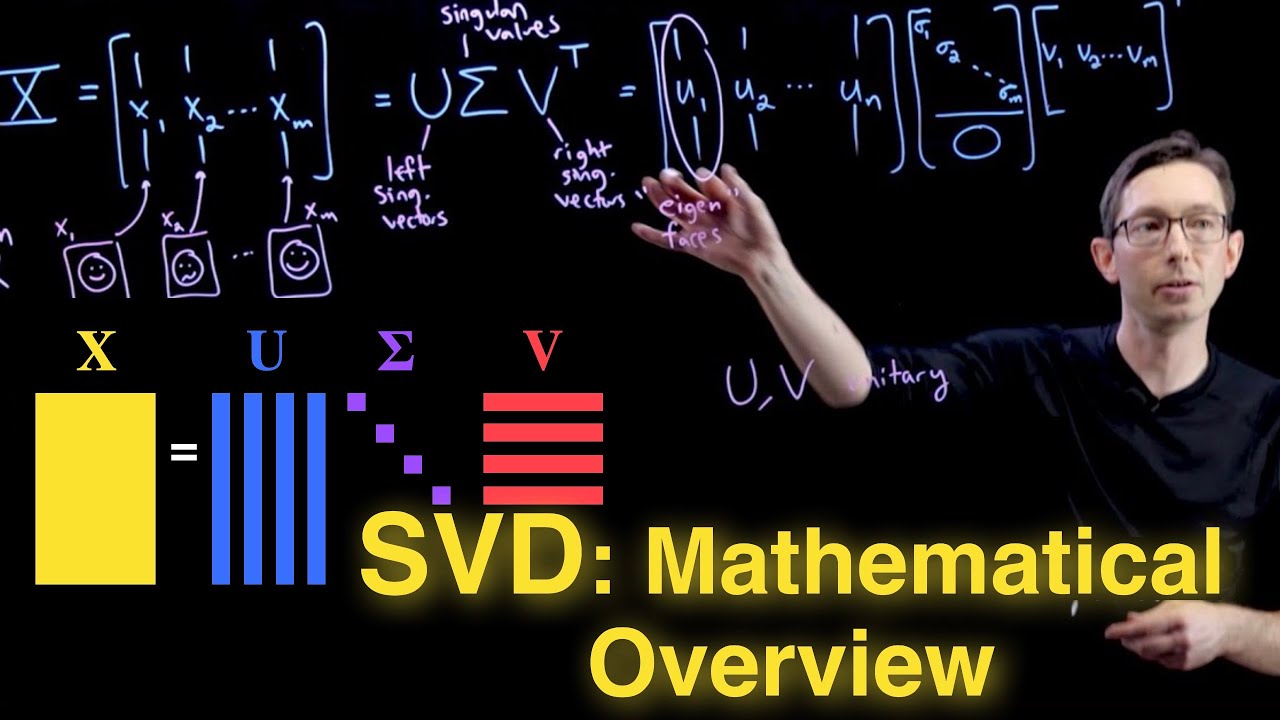
Singular Value Decomposition (SVD): Mathematical Overview

PCA Algorithm | Principal Component Analysis Algorithm | PCA in Machine Learning by Mahesh Huddar

Arbitrage basics | Finance & Capital Markets | Khan Academy
5.0 / 5 (0 votes)