Onion incipient plasmolysis experiment
Summary
TLDRThis educational script explains the concept of solute potential in plant cells through an experiment involving plasmolysis. It describes the process of placing onion cells in solutions with varying sucrose concentrations, observing the cells' turgid state and the onset of plasmolysis. The experiment aims to determine the solute potential by identifying the concentration at which 50% of cells exhibit incipient plasmolysis. The results are recorded, tabulated, and graphed to find the sucrose concentration corresponding to a solute potential of -1450 kPa.
Takeaways
- 🌿 **Concept of Water Potential**: The script explains the concept of water potential, which is zero for pure water and negative for solutions with solutes like salts and sugars.
- 🔬 **Plant Cell Structure**: It describes the structure of a plant cell, including the cell wall, cell membrane, cytoplasm, and nucleus.
- 💧 **Osmosis and Water Movement**: The process of osmosis is explained, where water moves from an area of higher water potential to an area of lower water potential.
- 🌱 **Turgidity and Plasmolysis**: The script discusses the states of turgid cells, where the cell is full of water, and plasmolysed cells, where water has left the cell causing the cell membrane to pull away from the cell wall.
- 📉 **Pressure Potential**: It introduces pressure potential, which is the force exerted by the cell membrane against the cell wall, and how it changes with the cell's water content.
- 📊 **Experimental Setup**: The script outlines an experiment where plant cells are placed in solutions of varying sucrose concentrations to observe the degree of plasmolysis.
- 🔍 **Observation and Data Collection**: It details the method of observing cells under a microscope and counting the number of turgid versus plasmolysed cells at different sucrose concentrations.
- 📈 **Data Analysis**: The process of plotting the results on a graph with sucrose concentration on the x-axis and the percentage of plasmolysed cells on the y-axis is described.
- ⚖️ **Incipient Plasmolysis**: The term 'incipient plasmolysis' is defined as the concentration at which 50% of cells show plasmolysis, which is used to determine the solute potential of the cell.
- 🔑 **Solute Potential Calculation**: The script concludes with calculating the solute potential of the cell by referencing a table that correlates solute potential with sucrose molarity.
Q & A
What is the significance of measuring the degree of incipient plasmolysis?
-Measuring the degree of incipient plasmolysis is significant as it helps determine the solute potential of a cell by observing the point at which 50% of cells in a sample exhibit plasmolysis.
What is meant by 'incipient plasmolysis'?
-'Incipient plasmolysis' refers to the point at which 50% of cells in a sample start to show signs of plasmolysis, which is the separation of the cell membrane from the cell wall due to water loss.
Why is the water potential of pure water considered to be zero?
-The water potential of pure water is considered to be zero because it serves as a reference point, with no solutes to create a gradient for water movement.
How does the presence of solutes within a cell affect its water potential?
-The presence of solutes within a cell lowers its water potential because solutes create a concentration gradient, making the inside of the cell have a water potential that is less than zero.
What is the relationship between water potential and osmosis?
-Water moves by osmosis from a region of higher water potential to a region of lower water potential, which typically means from outside the cell to inside when the cell's water potential is lower.
What is the term for the pressure exerted by the cytoplasm against the cell wall?
-The pressure exerted by the cytoplasm against the cell wall is called turgor pressure, which is a result of water entering the cell and causing the cytoplasm to expand.
What happens to the cell when it is placed in a solution with a higher solute potential than the cell's?
-When a cell is placed in a solution with a higher solute potential, water moves out of the cell by osmosis, leading to a decrease in cytoplasm volume and plasmolysis.
How is the solute potential of a cell determined in the experiment described?
-The solute potential of a cell is determined by finding the concentration of a sucrose solution that causes 50% of the cells to undergo incipient plasmolysis.
What is the independent variable in the experiment described in the script?
-The independent variable in the experiment is the concentration of the sucrose solution, which is varied to observe its effect on cell plasmolysis.
How are the results of the experiment recorded and analyzed?
-The results are recorded by counting the number of cells that show signs of plasmolysis at various sucrose concentrations and then plotted on a graph to determine the concentration at which 50% plasmolysis occurs.
What is the significance of the solute potential value of -1450 kiloPascals mentioned in the script?
-The solute potential value of -1450 kiloPascals is the water potential at which 50% of the cells in the experiment show incipient plasmolysis, indicating the solute potential of the cells used in the study.
Outlines

This section is available to paid users only. Please upgrade to access this part.
Upgrade NowMindmap

This section is available to paid users only. Please upgrade to access this part.
Upgrade NowKeywords

This section is available to paid users only. Please upgrade to access this part.
Upgrade NowHighlights

This section is available to paid users only. Please upgrade to access this part.
Upgrade NowTranscripts

This section is available to paid users only. Please upgrade to access this part.
Upgrade Now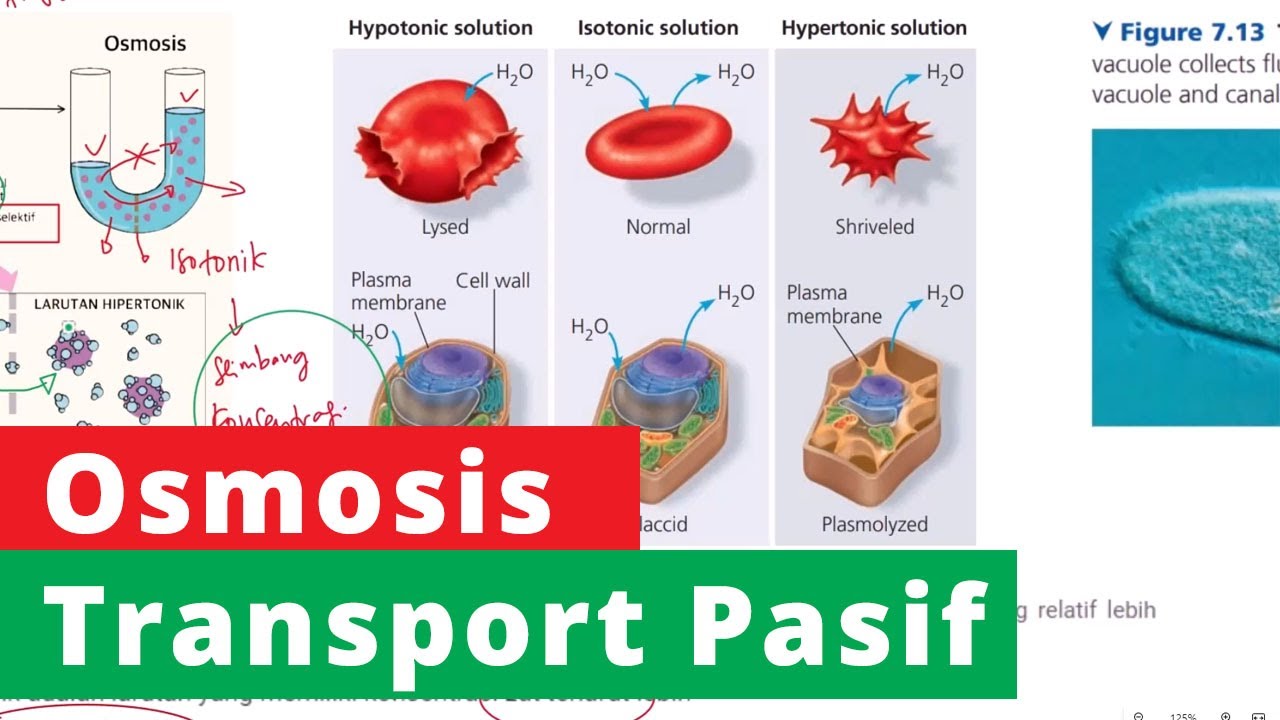


5.0 / 5 (0 votes)