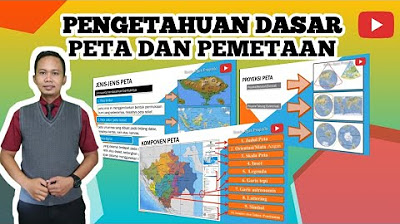
KOMPONEN PETA #geography #education #kurikulummerdeka

Fahmi Astathi
3 Oct 202005:16

Summary

TLDRThis educational video script introduces viewers to the components of a map, starting with the title which provides essential information about the map's content. It then explains the map's border, orientation, scale, and inset map, which adds clarity. The script also covers the legend, explaining symbols and colors used to represent different features, and the importance of map coordinates and symbols for conveying information. Lettering and the use of color to differentiate map features are also discussed. The script concludes with the significance of the map's source data and the mapmaker, emphasizing the accuracy and relevance of the map's information.

Takeaways

  • πŸ˜€ The first component of a map is the title, which provides essential information about the map's content.
  • πŸ—ΊοΈ The border or edge of the map is a line that outlines the map's perimeter, meeting at the corners.
  • 🧭 Orientation or compass rose indicates direction, typically with an arrow pointing north.
  • πŸ“ Scale represents the ratio of distances on the map to actual distances, with three types: numerical, linear, and verbal.
  • πŸ” Inset maps are smaller maps that provide additional clarity on specific areas within the main map.
  • πŸ“š Legends explain the symbols and colors used on the map to ensure easy understanding of the depicted information.
  • 🌐 Coordinates relate to the map's placement on the Earth's grid system, using latitude and longitude.
  • 🏞️ Symbols on a map represent various features, such as geometric, pictorial, line, color, and field symbols, and should be simple and clear.
  • ✍️ Lettering on a map includes all meaningful text, with different styles like capital, lowercase, and italics.
  • 🎨 Colors on a map are used to highlight differences between objects, such as land, water bodies, vegetation, and human-made structures.
  • πŸ“œ The source of data and the year of map creation are important for understanding the accuracy and relevance of the map's information.
  • πŸ‘€ The map's creator, such as an individual or institution, is credited for the map's production, ensuring accountability and reference.

Q & A

  • What is the first component of a map that readers typically look at?

    -The first component of a map that readers typically look at is the title. The title provides information about what the map contains, such as 'Digital Topographic Map of Indonesia'.

  • What is the purpose of map borders?

    -Map borders, or edges, are lines that are located at the edge of the map. They meet at the corners with adjacent borders, helping to define the boundaries of the map's area.

  • What is orientation and how is it usually represented on a map?

    -Orientation is a guide to direction, typically represented by an arrow pointing to the north. It helps users understand the direction on the map.

  • What is the function of a map scale and what are the three forms of scale presentation?

    -A map scale is a ratio representing the relationship between a distance on the map and the actual distance on the ground. The three forms of scale presentation are numerical scale, line scale, and verbal scale.

  • What is an inset map and what is its purpose?

    -An inset map is a smaller map that provides additional clarity on a specific area within the main map. It is used to explain the features of a particular region in more detail.

  • What is a legend on a map and why is it important?

    -A legend on a map is a key that explains all the symbols used on the map. It is important because it helps users understand the meaning behind the symbols and colors used to represent different features.

  • How are coordinates related to a map and what do they typically represent?

    -Coordinates on a map are related to the grid system of latitude and longitude lines. They help pinpoint exact locations on the map using degrees of latitude and longitude.

  • What is the purpose of map symbols and what types of symbols are commonly used?

    -Map symbols are used to represent features that are visible or invisible on the map in an informative way. Common types of symbols include geometric, pictorial, line, color, and field symbols.

  • What is lettering on a map and what are the different types of lettering styles?

    -Lettering on a map refers to all meaningful texts present on the map. Different types of lettering styles include capital letters, lowercase letters, a combination of both, and styles such as upright and italic.

  • How does the use of color on a map help in distinguishing different features?

    -The use of color on a map helps to highlight differences between objects, such as land, water bodies, vegetation, and human-made structures. Different colors are used to represent different features, making them easily distinguishable.

  • Why is it important to include data sources and the year of map creation on a map?

    -Including data sources and the year of map creation is important because it provides assurance about the accuracy of the information and helps readers analyze trends and changes over time.

  • Who is typically credited as the map maker and what does this indicate?

    -The map maker is credited as the individual or institution that created the map. This indicates the authority and source of the map's content, such as 'Pemerintah Kabupaten Bekasi' in the example provided.

Outlines

00:00

πŸ—ΊοΈ Components of a Map

This paragraph introduces the various components of a map, which are essential for understanding the information it presents. It starts with the map title, which is the first thing a reader notices and provides context, such as 'Digital Topographic Map of Indonesia.' It then discusses the map border, which is the edge of the map where lines meet. The orientation, typically indicated by an arrow pointing north, is also crucial. The scale of the map, which is the ratio of a distance on the map to the actual distance, comes in three forms: numerical, linear, and verbal. Insets are smaller maps that provide additional clarity, while the legend explains the symbols used on the map. Coordinates, related to latitude and longitude lines, help in precise location identification. Symbols on the map represent both visible and non-visible information, and they can be geometric, pictorial, linear, or color-based. Lettering refers to all meaningful texts on the map, including capital and lowercase letters, and various orientations. Colors on the map are used to highlight differences between objects, such as land, water bodies, vegetation, and human-made structures. The source of the map data and the year of creation are also important for ensuring accuracy and analyzing changes over time. The paragraph concludes with an example of a map made by the Bekasi Regency Government Development Planning Agency in 2011.

05:00

πŸ“œ Map Components Continued

The second paragraph continues the discussion on map components, emphasizing the importance of understanding each element for effective map reading. It reiterates that the map maker, in this case, the Bekasi Regency Government, plays a significant role in the map's credibility. The paragraph concludes by expressing hope that the video has been helpful and looks forward to the viewers' engagement with future videos, thus ending the educational segment on map components.

Mindmap

Keywords

πŸ’‘Map Components

Map components refer to the various elements that make up a map, providing essential information to the reader. In the video, the script discusses the significance of map components such as the title, border, orientation, scale, legend, and more, which are crucial for understanding what the map represents and how to read it.

πŸ’‘Title

The title of a map is its name or heading, which is typically the first thing a reader sees. It provides an immediate understanding of what the map is about. For instance, the script mentions 'Digital Topographic Map of Indonesia' as an example of a map title, indicating the content and geographical scope of the map.

πŸ’‘Border

Borders on a map are lines that define the edges of the map's representation. They help in situating the map's content within a larger geographical context. The script uses 'garis tepi' or 'border lines' to describe these edges, emphasizing their role in framing the map's area of interest.

πŸ’‘Orientation

Orientation in cartography is the indication of direction on a map, usually depicted by an arrow pointing north. It helps users to relate the map's directions to the real world. The script mentions 'orientasi' to explain how maps guide readers on the directionality, which is fundamental for navigation and spatial understanding.

πŸ’‘Scale

Scale on a map represents the ratio of a distance on the map to the actual distance on the ground. It is crucial for understanding the relative sizes and distances within the map. The script explains different types of scales, such as numerical, linear, and verbal, and how they help in interpreting the map's spatial information accurately.

πŸ’‘Inset Map

An inset map is a smaller map within a larger one, often used to provide additional detail or focus on a specific area. The script refers to 'insya peta' or 'inset map' as a component that offers clarity on smaller areas within the main map, enhancing the understanding of localized geographical features.

πŸ’‘Legend

A legend on a map is a key that explains the symbols and colors used to represent various features. It is essential for interpreting the map's content. The script discusses 'legenda peta' as a guide to the symbols, ensuring that the map's information is easily comprehensible.

πŸ’‘Coordinates

Coordinates on a map are used to pinpoint locations using a grid system of latitude and longitude lines. They are vital for precise geographical positioning. The script mentions 'koordinasi' in relation to 'garis bujur' and 'garis lintang' or 'longitude and latitude lines,' highlighting their importance in map reading.

πŸ’‘Symbols

Symbols on a map are graphical representations of geographical features. They can be geometric, pictorial, linear, color, or field symbols, and are used to convey information efficiently. The script explains the use of 'simbol peta' to represent various phenomena and features, such as roads, bodies of water, or administrative boundaries.

πŸ’‘Lettering

Lettering on a map refers to the textual information, including labels and names of features. It is crucial for providing names and additional details about the map's content. The script describes 'lettering' as an essential component that includes various forms of text, such as capital letters, lowercase letters, and italics, used to annotate the map.

πŸ’‘Color

Color on a map is used to differentiate and highlight various features, making the map more readable and visually informative. The script discusses how 'warna peta' or 'map colors' are used to distinguish between land, water bodies, vegetation, and human-made structures, enhancing the map's informational value.

πŸ’‘Source Data

Source data refers to the information used to create a map, ensuring its accuracy and reliability. The script mentions 'sumber data' and 'tahun pembuatan peta' or 'year of map creation' as important aspects that provide credibility to the map's content and help readers understand the temporal context of the data.

πŸ’‘Map Maker

A map maker is the individual or organization responsible for creating the map. They compile and interpret data to produce the final map. The script identifies 'pembuat peta' as the entity, such as a government agency, that is responsible for the map's creation, which is crucial for understanding the authority and context behind the map.

Highlights

Introduction to map components and their importance in conveying map information.

The necessity of a map title as the first element seen by the reader.

Explanation of the map border and its role in defining the map's edges.

Orientation on a map, typically indicated by an arrow pointing north.

Scale on a map represents the ratio of distances on the map to actual distances.

Three forms of map scale presentation: numerical, linear, and verbal.

Inset maps provide additional clarity within the main map.

Legends on maps explain the symbols used to represent various features.

The absence of a standard rule for the use of symbols and colors in legends.

Coordination on maps, related to the use of latitude and longitude lines.

Symbols on maps represent both visible and non-visible phenomena informatively.

Types of map symbols include geometric, pictorial, line, color, and field symbols.

Criteria for effective symbol use include simplicity, clarity, and small size.

Lettering on maps includes all meaningful text, such as labels and names.

Different types of lettering styles used on maps, like capital, small, and italics.

The use of color on maps to highlight differences between various objects.

Examples of colors used on maps to represent land, water, vegetation, and human-made structures.

White color on maps is used to depict snow-capped areas.

The importance of map sources and the year of creation for data accuracy and trend analysis.

Information on the map maker, such as an individual or institution, and the year the map was created.

Summary of the discussed map components and their significance in map reading.

Transcripts

play00:00

Hai uh salamualaikum warahmatullahi

play00:15

wabarakatuh Apa kabar semuanya Hari ini

play00:18

kita akan belajar mengenai komponen peta

play00:21

apa Apa saja komponen peta yang pertama

play00:23

Ada Judul peta pasti peta itu harus

play00:26

memiliki judul-judul peta memuat

play00:28

informasi Sesuai dengan informasi pada

play00:30

peta karena itu judul peta merupakan hal

play00:33

yang pertama dilihat oleh pembaca peta

play00:35

contohnya adalah kata rupabumi digital

play00:37

Indonesia Nah dari judul ini kita bisa

play00:40

mengetahui bahwa ini adalah peta

play00:43

rupabumi digital indonesia yang kedua

play00:46

ada garis tepi atau border ini adalah

play00:49

contoh dari garis tepinya nah garis tepi

play00:52

adalah garis yang terletak dibagian tepi

play00:54

peta dan ujung-ujung setiap garis

play00:57

bertemu dengan ujung garis yang

play00:59

berdekatan ya

play01:00

tiga ada orientasi reorientasi itu

play01:03

adalah petunjuk arah atau arah mata

play01:06

angin orientasi tak biasanya berbentuk

play01:08

tanda panah yang menunjuk ke arah utara

play01:11

nah yang keempat harus ada skala skala

play01:15

peta adalah perbandingan jarak antara

play01:17

dua titik sembarang atau luas wilayah di

play01:19

peta dan jarak sebenarnya dengan satuan

play01:22

ukuran yang sama Nah ada tiga bentuk

play01:24

penyajian skala pada peta yang pertama

play01:26

adalah skala angka atau lemari adalah

play01:28

skala yang dinyatakan dalam bentuk angka

play01:30

atau perbandingan lalu yang kedua adalah

play01:32

skala garis yang ketiga adalah kalah

play01:35

kalimat atau verbal nah yang kelima

play01:37

again serta pada insecta merupakan

play01:39

sebuah fakta tambahan yang mempunyai

play01:42

ukuran lebih kecil dan memberikan

play01:44

kejelasan yang terdapat didalam peta

play01:46

utama ini adalah contoh dari insya peta

play01:49

Desa peta ini merupakan sifat

play01:51

menjelaskan wilayah yang terdapat pada

play01:53

peta utama yang keenam harus ada

play01:56

legenda-legenda peta merupakan

play01:58

keterangan semua simbol

play02:00

terdapat pada peta agar tetap mudah

play02:02

dipahami sebenernya tidak ada aturan

play02:03

baku dalam penggunaan simbol dan warna

play02:06

yang menyajikan legenda sebuah informasi

play02:08

penting yang dapat ditinggalkan untuk

play02:10

menerjemahkan informasi pada suatu peta

play02:13

yang ketujuh harus ada koordinasi

play02:14

koordinasi itu berhubungan dengan garis

play02:17

bujur dari Galaxy Fame atau disebut juga

play02:19

dengan garis astronomis garis bujur dan

play02:22

garis lintang biasanya ditunjukkan

play02:23

dengan satuan derajat yang ke-8 harus

play02:26

ada simbol peta nah kenampakan pada peta

play02:29

tidak sama dengan yang ada di foto maka

play02:32

foto akan menampilkan bentuk apa adanya

play02:34

Adapun fakta menampilkan informasi baik

play02:37

yang tampak maupun tidak untuk

play02:39

menampilkan fenomena dan bentuk secara

play02:41

informatif digunakanlah simbol ini ada

play02:44

beberapa jenis simbol ada simbol

play02:46

geometrik simbol gambar simbol garis

play02:48

simbol warna dan simbol bidang kemudian

play02:50

ada beberapa syarat-syarat timbul pakai

play02:53

yang baik adalah yang pertama kecil

play02:55

sederhana dan jelas kemudiannya 9 adalah

play02:59

lettering

play03:00

file-nya lettering adalah semua tulisan

play03:02

yang bermakna yang terdapat pada peta

play03:04

ini adalah contoh dari lettering Craft

play03:06

whether gunungpuyuh kali Oppa ini adalah

play03:10

salah satu jenis dari lettering nah

play03:13

bentuk huruf yang meliputi huruf kapital

play03:16

huruf kecil combonya seluruh kapital dan

play03:18

kecil tegak dan miring Nah contoh

play03:21

penulisan pada peta adalah sebagai

play03:22

berikut kemudian yang 10 ada warna serta

play03:35

Nah warna peta lazim digunakan untuk

play03:38

menonjolkan perbedaan objek pada peta

play03:41

objek yang satu dengan objek lainnya

play03:43

perbedaan objek tersebut kemudian

play03:45

digambarkan dengan warna berbeda

play03:47

penggunaan peta beberapa tersebut antara

play03:49

lain terlihat sebagai hal berikut

play03:51

contohnya warna-warna yang telah temukan

play03:53

di peta ada warna coklat itu menampakan

play03:56

files muka bumi warna biru itu

play03:58

mengaktifkan Wilayah perairan

play04:00

pastinya sungai danau dan laut kemudian

play04:02

ada hijau itu menggambarkan kenampakan

play04:05

vegetasi hutan dan perkebunan kemudian

play04:08

ada warna merah dan hitam itu biasanya

play04:11

kenampakan hasil budaya manusia seperti

play04:13

Jalan Kota pemukiman batas wilayah dan

play04:16

Pelabuhan Udara kemudian warna putih

play04:18

untuk menggambarkan kenampakan SD

play04:20

permukaan bumi yang A11 ada sumber data

play04:23

dan tahun pembuatan peta ini juga

play04:24

penting loh sumber peta merupakan sumber

play04:27

data yang digunakan untuk pembuatan peta

play04:29

nah Sumber data memberi kepastian bahwa

play04:32

data informasi pada peta Accurate

play04:34

sementara itu tahun pembuatan peta dapat

play04:37

membantu pembaca untuk menganalisis

play04:39

berbagai kecenderungan perubahan

play04:40

fenomena dari waktu-waktu ini adalah

play04:43

contoh dari sumber peta dan tahun

play04:45

pembuatan peta kemudian yang ke-12

play04:48

adalah pembuat peta nah pembuat peta

play04:51

merupakan Orang atau lembaga yang

play04:53

membuat peta contohnya nah Pada peta ini

play04:56

yang membuat peta adalah Pemerintah

play04:58

Kabupaten Bekasi

play05:00

yups itu badan perencana Pembangunan

play05:01

Daerah pada tahun 2011 jadi pembuat peta

play05:05

adalah Pemerintah Kabupaten Bekasi

play05:07

demikianlah komponen-komponen peta yang

play05:09

sudah kita bahas semoga video ini

play05:11

bermanfaat dan satu bertemu kepada

play05:14

video-video selanjutnya terima kasih

Rate This
β˜…
β˜…
β˜…
β˜…
β˜…

5.0 / 5 (0 votes)

Related Tags
Map ComponentsGeographyOrientationScaleLegendCoordinatesSymbolsLetteringColor CodingData Source