KU 538 - Lecture 5

Edward Jepson
6 Dec 202111:30

Summary

TLDRThis lecture introduces Geographic Information Systems (GIS), highlighting their importance in planning and spatial data analysis. GIS integrates various data sources to create and update maps, analyze spatial information, and inform decisions on land use, natural resources, and demographics. It covers data storage in vector and raster formats, and discusses operations like proximity and overlay analysis. The lecture also touches on the benefits of GIS for public participation and planning, while cautioning about potential pitfalls such as unreliable map sources and misrepresentation of data.

Takeaways

  • πŸ“˜ This lecture is part of Chapter 5, focusing on Geographic Information Systems (GIS) from pages 125 to 142.
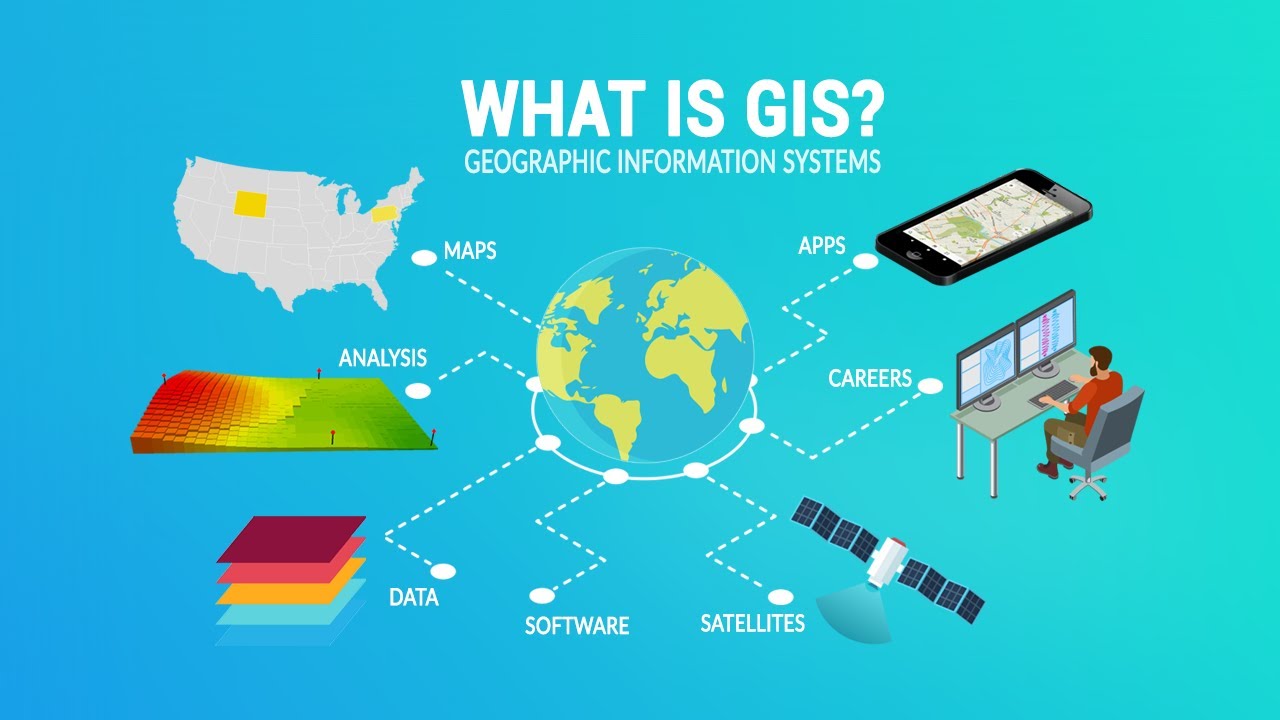
  • 🌐 GIS is a fundamental computer system used for applications requiring spatial information, particularly in land use and land use regulation planning.
  • πŸ’‘ GIS comprises computer technologies for entering, storing, processing, retrieving, and generating spatial data, aiding in map creation and integration of various data sources.
  • πŸ—ΊοΈ Data in GIS is stored in layers or themes, each containing geocoded information indicating the location of specific elements like land use or surface features.
  • πŸ“Š Two primary data formats in GIS are vector (points, lines, polygons) and raster (pixel-based), used for discrete and continuous data representation, respectively.
  • πŸ” GIS operations include queries, proximity analysis (distance between data points), and overlay analysis (combining information from different layers to create composite maps).
  • πŸ› οΈ GIS is powerful for planning, facilitating office inventories, land analysis, public participation, and scenario building in planning processes.
  • 🚧 Pitfalls of GIS include the risk of using unreliable map sources, poor map design, and misrepresentation of data, which can lead to inaccurate implications.
  • πŸ‘¨β€πŸ« Planners should develop basic GIS skills to effectively use the technology, though they don't need to be experts.
  • 🀝 Planners can collaborate with allied disciplines like geography and utilize online resources and courses, such as those on Plan Edison, to enhance their GIS capabilities.
  • 🌐 There are useful GIS data websites like the Geospatial Data Gateway and TIGER, providing access to a wide range of spatial data for various applications.

Q & A

  • What is the main topic of the lecture?

    -The main topic of the lecture is Geographic Information Systems (GIS), specifically focusing on its fundamentals and applications in the context of chapter five, pages 125 through 142.

  • What are the core functionalities of GIS according to the lecture?

    -The core functionalities of GIS include the entry, storage, processing, retrieval, and generation of spatial data, which is used to make and update maps, integrate maps with other information sources, analyze spatial information, and inform decisions about land use, natural resources, demographics, and commercial markets.

  • What does GIS consist of in terms of data layers?

    -GIS consists of data layers or themes that store spatial data. Each layer contains geocoded information indicating the location of particular elements such as land use or surface features, typically in the form of longitude, latitude, address, or census blocks.

  • What are the two formats in which data is stored and manipulated in GIS?

    -The two formats in which data is stored and manipulated in GIS are vector and raster. Vector data represents discrete data as points, lines, or polygons, while raster data uses number-coded pixels to represent discrete or continuous data.

  • How does GIS facilitate planning and public participation?

    -GIS facilitates planning by enabling office inventories, land analysis, and public participation in planning processes. It helps provide information for visioning and scenario building, and aids in visualization and presentation to the public to enhance understanding of community changes and realities.

  • What are the types of analysis performed in GIS?

    -In GIS, two types of analysis are performed: proximity analysis, which determines the distances between data points, lines, and polygons; and overlay analysis, which combines information from different layers to create composite maps that can answer specific spatial questions.

  • What are some of the pitfalls mentioned in the lecture regarding the use of GIS?

    -Some pitfalls of using GIS include failing to vet map sources for reliability and accuracy, poor map design that presents too much information, and misrepresentation of data that can lead to incorrect implications.

  • What suggestions does the lecture provide for planners regarding the use of GIS?

    -The lecture suggests that planners should focus on approaches that improve public participation through GIS, develop and maintain fundamental GIS skills, and partner with allied disciplines like geography.

  • What are some resources mentioned for planners to learn more about GIS?

    -The lecture mentions Plan Edison as a website offering GIS courses designed for planners, and two useful GIS data websites: the Geospatial Data Gateway by the Natural Resources Conservation Service, and TIGER, which provides spatial data including geographic data divided by political areas.

  • What is the difference between vector and raster data in the context of the lecture?

    -Vector data in GIS represents discrete data as points, lines, or polygons, suitable for representing distinct features like buildings or roads. Raster data, on the other hand, uses pixels to represent both discrete and continuous data, such as topography or pollution levels, covering an area of interest.

  • How can GIS be used to inform decisions about land use and natural resources?

    -GIS can be used to inform decisions about land use and natural resources by integrating and analyzing spatial data from various sources, such as land use regulations and actual land use data, to provide insights into patterns and relationships that can guide decision-making.

Outlines

00:00

πŸ“ Introduction to Geographic Information Systems (GIS)

This lecture is part of Chapter 5, focusing on Geographic Information Systems (GIS) from pages 125 to 142. The purpose is to introduce GIS, a fundamental computer system for applications requiring spatial information, particularly in land use and land use regulation for planners. GIS is a set of computer technologies for managing spatial data, including data entry, storage, processing, retrieval, and generation. It is used for map creation and updates, integrating various data sources, analyzing spatial information, and aiding in decision-making regarding land use, natural resources, demographics, and commercial markets. GIS consists of data layers or themes that store geocoded spatial data, which can be linked to geographic coordinates like longitude, latitude, addresses, or census blocks. The data is stored and manipulated in vector formats, representing discrete data as points, lines, and polygons, and raster formats, which use pixel-coded data to represent continuous data. The lecture also includes a visual display of GIS data in both raster and vector formats.

05:01

πŸ” Analyzing GIS Data: Queries and Pitfalls

In GIS, 'queries' refer to questions that can be answered by combining different data layers through proximity analysis, which examines the distances between data points, lines, and polygons, and overlay analysis, which creates composite maps by combining information from various layers. Overlay analysis can be used to assess suitability for wildlife preservation, for example, by considering forest characteristics, parcel sizes, water sources, topography, and proximity to development. The lecture discusses the power of GIS in facilitating planning, inventory management, land analysis, public information, and participation in planning processes. It also highlights the importance of using valid map sources, avoiding poor map design, and preventing misrepresentation of data. Planners are encouraged to develop fundamental GIS skills and to partner with allied disciplines like geography. The lecture suggests focusing on approaches that enhance public participation and recommends resources for learning GIS, including courses from Plan Edison and data from the Geospatial Data Gateway and TIGER.

10:02

🌐 GIS Data Resources and Education for Planners

The lecture highlights the availability of GIS courses designed specifically for planners, such as those found on the Plan Edison website, which come with a fee but offer valuable learning opportunities. It also points to the Geospatial Data Gateway, a resource maintained by the Natural Resources Conservation Service, providing access to vector and raster layers across the country. Another mentioned resource is the federal site TIGER, which offers a wide range of spatial data including rivers, lakes, buildings, roads, and geographic data categorized by political areas like cities, counties, and zip codes. The lecture emphasizes the importance of these resources for planners to enhance their GIS skills and utilize them effectively in their work.

Mindmap

Keywords

πŸ’‘Geographic Information Systems (GIS)

GIS is a set of computer technologies that manage and analyze spatial data to make and update maps, integrate information from various sources, and inform decisions about land use, natural resources, and demographics. In the video, GIS is presented as a fundamental tool for planners, enabling them to analyze spatial information and support decision-making processes.

πŸ’‘Spatial Data

Spatial data refers to information that is referenced to a specific location on the Earth. It can include longitude and latitude, addresses, or other geographic coordinates. In the context of the video, spatial data is crucial for GIS as it forms the basis for creating and analyzing maps and other geographic information.

πŸ’‘Geocoding

Geocoding is the process of assigning geographic coordinates to a given set of data, such as addresses or place names. This allows for the integration of data with mapping systems, which is essential for GIS. The video mentions that data layers in GIS contain geocoded information, indicating the location of features like land use or surface elements.

πŸ’‘Data Layers or Themes

Data layers or themes in GIS are collections of spatial data that represent different aspects of the environment, such as land use, topography, or demographics. Each layer can be thought of as a map that can be overlaid on others to analyze relationships and patterns. The video explains that GIS consists of these layers, which store spatial data and are used to inform decisions.

πŸ’‘Vector Data

Vector data in GIS represents discrete data as points, lines, and polygons. Points might represent buildings, lines could be roads or streams, and polygons might represent areas like wetlands or forests. The video uses vector data as an example of how discrete spatial data can be stored and manipulated in GIS.

πŸ’‘Raster Data

Raster data, as mentioned in the video, uses pixels to represent spatial data. It is particularly useful for representing continuous data or field data, such as topography or pollution levels, where different pixel values can indicate varying magnitudes. The video contrasts raster data with vector data, showing how it is organized by pixels.

πŸ’‘Proximity Analysis

Proximity analysis in GIS involves determining the distances between data points, lines, and polygons. This type of analysis can be used to answer questions about the spatial relationships between features, such as how close certain land uses are to each other. The video describes proximity as one of the types of analysis that can be performed using GIS.

πŸ’‘Overlay Analysis

Overlay analysis in GIS combines information from different data layers to create composite maps. This can be used to assess suitability for certain uses, such as wildlife preservation, by considering factors like forest characteristics, parcel sizes, and water sources. The video explains overlay analysis as a way to create new insights by combining layers.

πŸ’‘Public Participation

Public participation in the context of the video refers to the involvement of community members in planning processes. GIS can facilitate this by providing visualizations and presentations that help the public understand potential changes and the current state of their community. The video highlights the importance of GIS in enhancing public engagement in planning.

πŸ’‘Map Sources

Map sources are the origins of the data used in GIS. The video emphasizes the importance of vetting these sources to ensure their reliability and accuracy. Poor map design or misrepresentation can occur if the sources are not valid, which can lead to inaccurate or misleading information in planning and decision-making.

Highlights

Geographic Information Systems (GIS) are fundamental computer systems for applications requiring spatial information.

GIS is used for land use and land use regulation, especially in planning domains.

GIS consists of computer technologies for entry, storage, processing, retrieval, and generation of spatial data.

GIS is used to make and update maps, integrate maps with other information, and analyze spatial data.

Data layers or themes in GIS store spatial data with geocoded geographic coordinates.

GIS data can be stored and manipulated in vector (points, lines, polygons) and raster formats.

Vector data represents discrete data points such as buildings, lines like roads, and polygons like forest areas.

Raster data uses pixels to represent continuous data, such as topography or pollution levels.

GIS operations include queries, proximity analysis, and overlay analysis to combine information from different layers.

GIS facilitates planning, land analysis, and public participation in planning processes.

Planners can use GIS for visioning and scenario building to inform community development.

GIS can be used for visualization and presentation to help the public understand community changes.

Care must be taken to use valid and accurate map sources in GIS to avoid misrepresentation.

Poor map design can lead to confusion, so it's important to present information clearly.

Planners do not need to be GIS experts but should develop fundamental skills to use it effectively.

Partnering with allied disciplines like geography can enhance the use of GIS in planning.

There are online GIS courses designed for planners, such as those on the Plan Edison website.

The Geospatial Data Gateway and TIGER are useful websites for accessing vector and raster layers for GIS.

Transcripts

play00:00

uh hello this uh this lecture

play00:02

corresponds to a part of chapter five

play00:06

um really just the part about geographic

play00:08

information systems and that would be

play00:10

the reason this will correspond to pages

play00:12

125 through

play00:14

142. and the purpose of this lecture is

play00:18

to provide a brief introduction

play00:20

to geographic information systems which

play00:23

have emerged as one of the most widely

play00:25

used and fundamental computer systems

play00:28

for any application requiring spatial

play00:30

information

play00:31

especially the planner's domain of land

play00:33

use and land use regulation

play00:41

okay so

play00:43

what are some of the fundamentals of

play00:44

geographic information systems

play00:49

ges g excuse me gis is a set of

play00:52

interrelated computer technologies

play00:55

that achieve the entry storage

play00:58

processing retrieval and generation of

play01:00

spatial data

play01:02

it is used to make

play01:03

and update maps

play01:05

integrate maps and other information

play01:07

from a variety of sources such as

play01:09

land use regulations let's say and

play01:12

actual

play01:13

land use data

play01:16

analyze spatial information and inform

play01:18

decisions about land use

play01:20

natural resources demographics

play01:22

commercial markets and and numerous

play01:25

other applications with spatial

play01:27

dimensions so pretty much you can it's

play01:29

pretty obvious how this would be useful

play01:32

to planners

play01:37

there are it consists of data layers or

play01:40

themes these these data layers or themes

play01:44

store spatial data

play01:46

and they each contain information that

play01:48

is quote geocoded

play01:50

in geographic

play01:52

coordinates indicating the location of

play01:55

some

play01:57

particular element land use

play01:59

or surface element

play02:03

the location would be in the form of

play02:05

longitude latitude maybe

play02:07

address

play02:08

and maybe census blocks

play02:11

by linking information to geographic

play02:14

coordinates in this way a gis labor

play02:17

layer can access information for any

play02:19

location for example what are the soils

play02:21

here

play02:22

as well as locate specific information

play02:25

such as where

play02:26

are the

play02:28

where are the wetlands

play02:34

these data are stored and manipulated in

play02:36

two formats

play02:39

first there are vector points these

play02:43

these represent discrete data

play02:46

and the points are generally or there

play02:48

are

play02:50

the type of data is represented as

play02:52

points such as buildings

play02:55

lines

play02:56

such as roads streams that sort of thing

play02:59

and polygons or

play03:01

you know various shapes to represent

play03:04

wetlands forest areas anything

play03:07

that covers a an area

play03:12

and then there's what is known as raster

play03:14

data

play03:15

and this involves the use of number

play03:17

coded pixels to represent discrete data

play03:21

but it's mainly used to represent

play03:23

continuous data or field data that is

play03:26

information that is common throughout an

play03:28

area of interest

play03:30

different pixel number values can

play03:32

indicate the magnitude of something such

play03:34

as

play03:35

different numbers can be used to

play03:37

represent higher or low top lower

play03:39

topography

play03:40

higher or lower

play03:42

varying levels of pollution

play03:46

some of this can change over time

play03:50

so those are those are two important

play03:52

aspects of gis that

play03:54

that i'd like you to at least

play03:57

understand or realize

play04:00

and here

play04:01

is a

play04:02

geographic display of it here

play04:04

on the top you can see the rest of

play04:06

raster data and there are the pixels

play04:10

um

play04:11

in the in the middle section as it

play04:13

indicates is the factor vector data

play04:16

format

play04:17

um which are in this case you can see

play04:19

there are lines and there are polygons

play04:22

points would be like houses perhaps

play04:25

buildings

play04:27

and then this is all comes out of the

play04:28

real world which may come from an

play04:30

aerophotograph photograph or

play04:32

satellite image

play04:35

so you can see that

play04:37

the green area in the vector

play04:40

format represents the forest

play04:43

and that color also represents the

play04:46

forest in the raster

play04:48

format although it is as

play04:50

explained it is organized by pixels

play04:54

and designed by pixels

play05:00

okay operations and analysis in gis

play05:08

queries is a term that is used in

play05:13

gis

play05:15

that refers to questions that can be

play05:16

answered by using or combining different

play05:18

layers through two two types

play05:21

of analysis

play05:23

one type of analysis is known as

play05:24

proximity

play05:26

and as you might expect that would be

play05:28

the distances between data points lines

play05:31

and polygons

play05:35

the other

play05:36

type of

play05:40

data layer

play05:41

or analysis of data layers is with

play05:44

overlay

play05:45

these are composite maps

play05:47

that combine information this can

play05:49

be um

play05:52

for example it would show

play05:55

whether a particular area is good for

play05:57

wildlife

play05:59

preserve preservation and that might

play06:01

involve forest characteristics size of

play06:04

particle parcels

play06:06

locations of water sources

play06:08

topography

play06:10

distance from development that sort of

play06:11

thing

play06:18

so i'll

play06:19

briefly go over the power and pitfalls

play06:21

of

play06:22

gis

play06:24

gis

play06:26

facilitates

play06:30

planning office inventories and land

play06:32

analysis

play06:36

you as a planner

play06:38

would use it

play06:39

to do analyses

play06:41

that then

play06:42

may be used to inform the public

play06:47

and it also facilitates public

play06:49

participation and planning processes

play06:52

by helping

play06:54

provide information for visioning and

play06:56

scenario building

play06:58

visioning i.e where do we want our

play06:59

community to be where is our community

play07:01

likely to be

play07:02

uh scenario building i.e

play07:05

what are the

play07:07

forces what are what are the uh

play07:11

forces outside of our community that we

play07:13

need

play07:14

to consider that might have an effect on

play07:17

on our quality of life the nature of our

play07:19

community

play07:20

and also

play07:22

public participation related to

play07:23

visualization and presentation

play07:25

obviously you can show how things will

play07:28

change

play07:30

you can show how things are so that the

play07:33

public will get a better sense for the

play07:35

reality of their community

play07:38

some of the pitfalls

play07:40

of

play07:43

gis or

play07:45

these aren't all the ones mentioned in

play07:46

the book these are i think the key ones

play07:48

um one of the things you have to be

play07:50

careful about is that you don't fail to

play07:51

vet the map sources use

play07:54

valid

play07:55

map sources evaluate those map sources

play07:57

make sure they're reliable and accurate

play08:00

um poor map design

play08:02

you know you want to make sure you have

play08:03

all the elements of the map title scale

play08:07

legends

play08:09

um

play08:10

over don't make don't present too much

play08:12

information

play08:13

it's complicated and

play08:16

too

play08:16

uh busy for people to understand or

play08:20

uh

play08:21

gain

play08:22

knowledge from

play08:24

misrepresentation

play08:26

is really just the idea that you know

play08:28

you're you're showing the data

play08:32

in a way that isn't quite accurate

play08:36

there might be

play08:38

there might be something implied by data

play08:40

and this this implication might be

play08:43

in some way a misrepresentation

play08:48

and then there are some suggestions for

play08:50

planners

play08:52

um

play08:53

that one of the important uses of gis

play08:56

for planners is the participation

play08:59

how it facilitates that

play09:01

so it's important to focus on

play09:03

those

play09:04

types of approaches and techniques that

play09:06

make gis

play09:08

a

play09:09

an effective way to improve public

play09:12

participation

play09:14

it's important that planners develop and

play09:16

maintain fundamental skills they don't

play09:18

have to necessarily be gis experts

play09:23

but some skills just to be able to use

play09:25

it at least in some

play09:27

to some degree is important

play09:32

and finally

play09:33

planners can partner with allied

play09:34

disciplines such as geography in

play09:36

particular

play09:37

um

play09:39

that has a more

play09:41

that

play09:42

it's more integrated into the skill

play09:45

domain

play09:46

of

play09:47

of that discipline

play09:52

one thing i'll mention is there i'm sure

play09:54

you're all familiar with the the website

play09:56

plan edison

play09:57

and they have a nice

play09:59

set of gis courses that are specifically

play10:02

designed

play10:04

for planners and here's just a

play10:07

screenshot from their from their website

play10:10

excuse me

play10:13

now these generally

play10:16

cost there's usually a fee for these

play10:18

courses but they are there

play10:21

and then there's i'll just point out a

play10:23

couple useful gis data websites

play10:27

one is

play10:28

maintained by the natural resources

play10:29

conservation service and it's called the

play10:31

geospatial data gateway

play10:34

and as you can see there provides access

play10:36

to

play10:37

vector and raster layers

play10:42

it's the whole country

play10:44

and it's available to anyone at any time

play10:48

and then you have another federal site

play10:51

tiger

play10:52

and this is now one thing about the

play10:54

natural resources conservation service

play10:56

this is this is limited environmental

play10:58

and nat natural resources data

play11:01

so you won't find

play11:03

information about

play11:05

you know

play11:07

housing that sort of thing now tiger is

play11:10

provides all sorts of uh spatial data as

play11:13

it as you can see

play11:14

rivers lakes buildings roads

play11:17

it also includes geographic data it's

play11:18

divided you can identify

play11:20

data on bases of political areas cities

play11:23

counties zip codes

Rate This
β˜…
β˜…
β˜…
β˜…
β˜…

5.0 / 5 (0 votes)

Related Tags
GISSpatial AnalysisLand UseData LayersVector DataRaster DataPlanner ToolsPublic ParticipationMap SourcesGeocoded Data