36. Regressione: bontà d'adattamento
Summary
TLDRThe transcript discusses the process of finding the regression line that represents the average dependence of y on x. It then explores evaluating the fit of this regression line to observed data through the concept of deviation of ypsilon, which is the sum of the squared differences between observed and mean values of y. The deviation is further broken down into regression deviation and error deviation. The script explains how to calculate the index of determination (R-squared) to assess the model's fit, which ranges from 0 to 1, indicating a perfect fit when equal to 1 and a poor fit when close to 0. The speaker also covers alternative methods for calculating regression deviation and provides examples to illustrate these concepts.
Takeaways
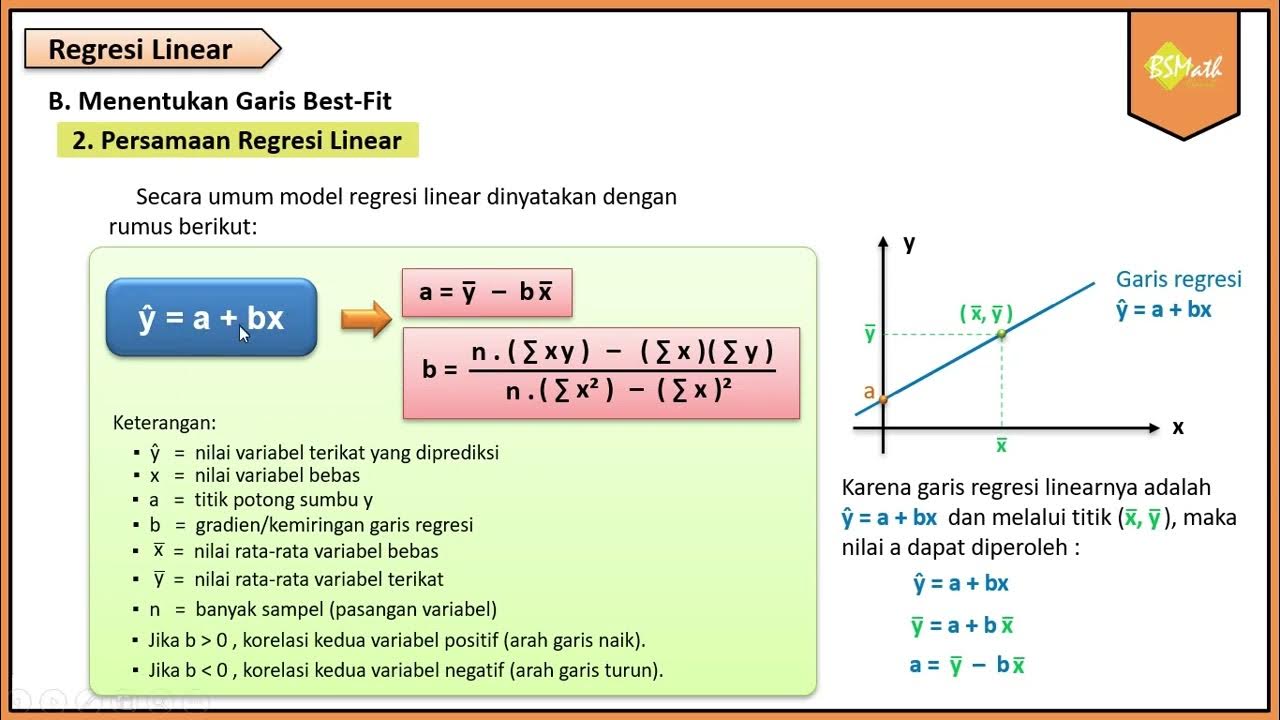
- 📉 The regression line represents the average dependency of y on x.
- 🔍 The goodness of fit for a regression line evaluates how well the model represents observed data.
- ➗ Total deviance of y can be split into regression deviance and error deviance.
- 📏 The coefficient of determination (R²) is used to assess the fit of the regression model.
- 0️⃣ If R² is close to 0, the model is poor; if it’s 1, the model is perfect.
- 🔺 Deviance of regression can be calculated with a simpler formula involving xy covariance.
- 🧮 R² is the proportion of variability in y explained by x; in one example, it was 61%.
- ⚠️ The model might explain only a part of the variability, with other factors influencing the rest.
- 📊 In a weighted case, the deviance of regression is calculated differently but follows similar principles.
- 🤔 A low R² suggests the model does not fit well, with much of the variability attributed to other factors.
Q & A
What is the purpose of the regression line in the context of the script?
-The regression line, or the line of regression, is used to express the average dependency of the variable 'y' on the independent variable 'x'. It represents the trend of the relationship between the two variables.
How is the goodness of fit of the regression line assessed?
-The goodness of fit is assessed by examining the deviation of 'ypsilon' (the dependent variable) from the mean of 'y'. This is broken down into two components: the regression deviation and the error deviation.
What does the regression deviation represent?
-The regression deviation is the sum of the squared differences between the predicted values ('y hat') and the mean of 'y'. It measures how well the regression line fits the data points.
What is meant by the error deviation in the script?
-The error deviation is the sum of the squared differences between the actual values of 'y' and the predicted values ('y hat'). It represents the part of the variation in 'y' that is not explained by the regression line.
How is the total deviation of 'ypsilon' calculated?
-The total deviation of 'ypsilon' is calculated by summing the squared differences between each observed 'y' value and the overall mean of 'y'.
What is the significance of the determination index (R-squared) in the script?
-The determination index, often denoted as R-squared, is a measure of how well the regression line fits the data. It is calculated as the ratio of the regression deviation to the total deviation of 'ypsilon'. It varies between 0 and 1, with values closer to 1 indicating a better fit.
What does an R-squared value of 0 indicate about the regression model?
-An R-squared value of 0 indicates that the regression model is not suitable for representing the observed phenomenon, meaning the regression line does not fit the data at all.
How is the alternative formula for calculating the regression deviation used?
-The alternative formula for calculating the regression deviation involves the product of the sum of the cross-deviations of 'x' and 'y' divided by the sum of the deviations of 'x'. This method can be more convenient when dealing with a large number of data points.
What is the interpretation of an R-squared value of 0.61 as mentioned in the script?
-An R-squared value of 0.61 suggests that the linear relationship between 'y' (the dependent variable) and 'x' (the independent variable) explains 61% of the variability in 'y'. This indicates that the regression model fits the data reasonably well.
How does the script differentiate between the simple and weighted cases in regression analysis?
-The script differentiates between the simple and weighted cases by adjusting the formulas for calculating the regression deviation and the determination index to account for the weights assigned to each data point in the weighted case.
What is the coefficient of correlation squared mentioned in the script?
-The coefficient of correlation squared refers to the square of the Pearson correlation coefficient, which is used to measure the strength and direction of the linear relationship between two variables. In the context of regression analysis, it is equivalent to the R-squared value.
Outlines

This section is available to paid users only. Please upgrade to access this part.
Upgrade NowMindmap

This section is available to paid users only. Please upgrade to access this part.
Upgrade NowKeywords

This section is available to paid users only. Please upgrade to access this part.
Upgrade NowHighlights

This section is available to paid users only. Please upgrade to access this part.
Upgrade NowTranscripts

This section is available to paid users only. Please upgrade to access this part.
Upgrade NowBrowse More Related Video

35. Regressione Lineare Semplice (Spiegata passo dopo passo)

REGRESI LINEAR I Best Fit

Persamaan Regresi Linear - Matematika Wajib SMA Kelas XI Kurikulum Merdeka

Pengertian Regresi Linear - Matematika Wajib Kelas XI Kurikulum Merdeka

Simple Linear Regression Concept | Statistics Tutorial #32 | MarinStatsLectures

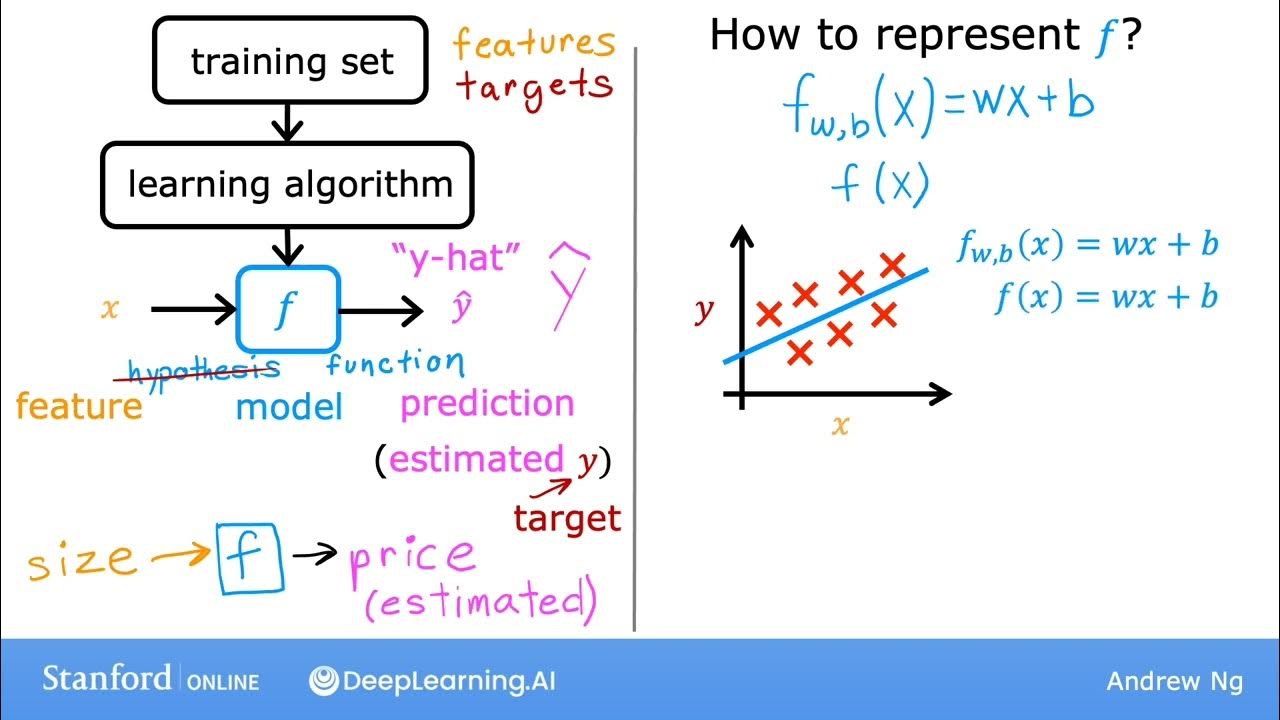
#10 Machine Learning Specialization [Course 1, Week 1, Lesson 3]
5.0 / 5 (0 votes)