2022 ICT Mentorship Episode 16
Summary
TLDRThe video breaks down the intricacies of market movement and trading strategies, emphasizing algorithmic forces driving price action. It stresses the importance of understanding liquidity pools, premium/discount zones, and order blocks for successful trade setups. The speaker challenges conventional trading wisdom, encouraging traders to focus on simplicity, consistency, and backtesting to internalize their unique trading model. By emphasizing risk management and providing practical tips on trade pyramiding and journal tracking, the video offers a comprehensive approach to mastering market dynamics and achieving consistent results.
Takeaways
- 😀 The market has distinct morning and PM sessions; multiple trading setups can occur within each session.
- 😀 Morning sessions typically feature high volatility at the open, providing 2–3 potential trade setups.
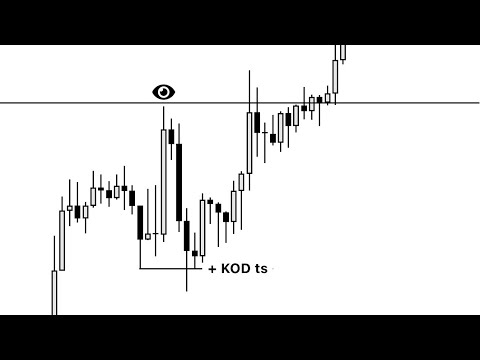
- 😀 Identify swing highs/lows, relative equal highs/lows, and fair value gaps as key points for entry and liquidity targeting.
- 😀 Order blocks represent areas of strong directional movement and can act as intraday support or resistance.
- 😀 Market behavior is largely algorithmic and liquidity-driven, not influenced by retail buying/selling pressure.
- 😀 Fibonacci measurements should be anchored on candle bodies (open/close) rather than wicks to project realistic price targets.
- 😀 Partial profit-taking and pyramiding positions help manage risk while maximizing equity growth.
- 😀 Higher time frames provide context for bias and direction; lower time frames are used for precise entries.
- 😀 Backtesting with annotations, journaling, and self-talk reinforces pattern recognition and internalizes setups.
- 😀 Patience, repetition, and identifying one’s unique model are critical for consistent trading results.
- 😀 Liquidity pools, premium/discount arrays, and fair value gaps guide intraday movement and potential reversals.
- 😀 Trading success depends on probabilities, discipline, and understanding market mechanics, not guessing or arbitrary indicators.
Q & A
What is the main focus of the trading lesson in the transcript?
-The lesson focuses on identifying multiple trade setups within intraday sessions, particularly in the S&P 500 E-mini futures, using concepts like order blocks, fair value gaps, swing highs/lows, liquidity, and premium/discount analysis.
How does the speaker define multiple setups within a trading session?
-Multiple setups refer to several high-probability trade opportunities that can occur during the morning and afternoon sessions, based on market structure, liquidity zones, and retracements into fair value gaps or order blocks.
What is the significance of swing highs and swing lows in this methodology?
-Swing highs and lows are used to measure potential price targets and anticipate market moves. They are distinct from fractals and help anchor Fibonacci measurements for precise projections.
What role do bullish and bearish order blocks play in trading setups?
-Order blocks serve as zones where price is likely to reverse or pause due to resting liquidity. Bullish order blocks act as support in a discount market, while bearish order blocks act as resistance in a premium market.
How are fair value gaps (FVGs) utilized in this trading approach?
-Fair value gaps identify price imbalances where the market may retrace, providing potential entry points. Traders look for price returning to these gaps before continuation in the anticipated direction.
What is meant by premium and discount markets?
-Premium markets are above key levels where price may retrace downward, while discount markets are below key levels where price may move upward. Algorithms tend to move price between these zones to seek liquidity.
How does the speaker suggest managing multiple positions and trade exits?
-The speaker advises taking partial profits, moving stops to break-even, and carefully pyramiding positions by putting on larger positions first, then smaller positions as price moves toward targets.
Why does the speaker claim that traditional indicators like supply/demand zones or Elliott Wave are not central to this strategy?
-The speaker emphasizes that market movement is largely algorithmic, driven by liquidity and order flow, rather than retail buying/selling pressure, making conventional indicators less relevant.
What is the importance of backtesting and annotating charts according to the speaker?
-Backtesting and annotation help traders internalize repeatable setups, reinforce positive reinforcement, and develop a unique model that identifies high-probability trade opportunities consistently.
How does the speaker define a 'unique model' for a trader?
-A unique model is a repeatable setup that a trader identifies consistently in different charts or timeframes, tailored to their personal style and approach, allowing them to participate effectively in intraday trades.
How should traders approach missed trade opportunities?
-Traders should not be upset by missed trades; setups repeat like buses. Understanding market structure, liquidity, and potential targets ensures that other opportunities will present themselves throughout the session.
What is the recommended mindset for learning this trading method?
-Traders should be patient, disciplined, and focused on observation and backtesting. They should avoid preconceived notions, study setups at their own pace, and use positive reinforcement to internalize patterns.
Outlines

This section is available to paid users only. Please upgrade to access this part.
Upgrade NowMindmap

This section is available to paid users only. Please upgrade to access this part.
Upgrade NowKeywords

This section is available to paid users only. Please upgrade to access this part.
Upgrade NowHighlights

This section is available to paid users only. Please upgrade to access this part.
Upgrade NowTranscripts

This section is available to paid users only. Please upgrade to access this part.
Upgrade NowBrowse More Related Video

You need to know what a LRLR is ❗

Market Maker Models in Smart Money Trading

ICT TRADING HOW TO USE DXY FOR DAILY BIAS AND RISK-ON RISK-OFF BIAS.

Intro to TAPDA - Time and Price Algorithmic PD Arrays | Banned video @Zeussy X RichTheBull
CRT secrets episode 2: The kiss of death

ICT 2026 New York Lunch Algorithmic Theory \ March 11, 2026
5.0 / 5 (0 votes)