GraphRAG: The Marriage of Knowledge Graphs and RAG: Emil Eifrem
Summary
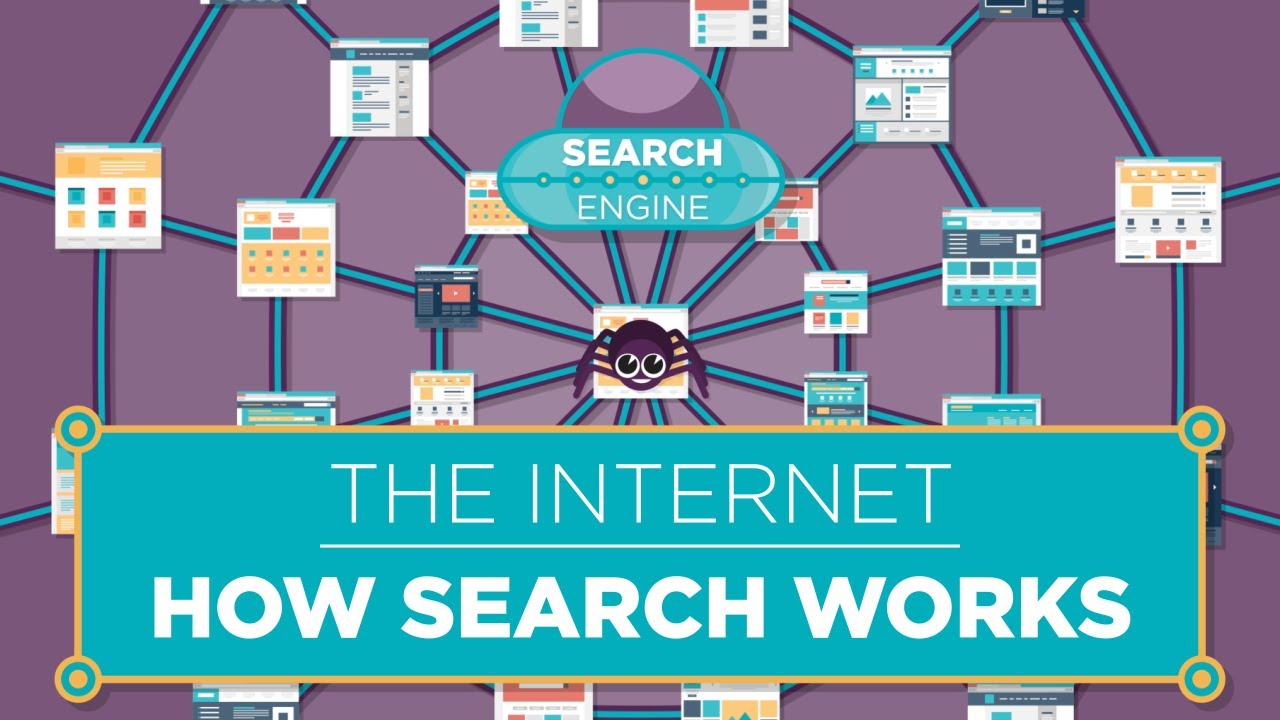
TLDRIn this talk, the speaker explores the evolution of search technology, from the early days of keyword-based searches to Google's revolutionary PageRank and the introduction of the Knowledge Graph. Highlighting the emergence of graph-based retrieval applications, particularly in customer service bots, the speaker emphasizes the enhanced accuracy and development efficiency that come with integrating Knowledge Graphs. By illustrating practical examples and recent advancements in AI, such as the graph-augmented retrieval approach, the speaker invites the audience to consider the significant benefits and innovations in search technology, positioning it as a powerful tool for better data utilization.
Takeaways
- 😀 The evolution of web search transitioned from early keyword-based engines like AltaVista to Google's advanced algorithms, improving search accuracy significantly.
- 📊 Google’s PageRank algorithm revolutionized search by ranking results based on the importance of web pages, utilizing a graph algorithm.
- 📚 The introduction of the Knowledge Graph in 2012 allowed Google to enhance search by embedding relationships and concepts within data, rather than just focusing on text strings.
- 🔗 Graph RAG (Retrieval-Augmented Generation with Knowledge Graphs) combines vector searches with Knowledge Graphs to improve application functionality, such as customer service bots.
- 🛠️ The implementation of Graph RAG can retrieve relevant documents and traverse graphs to provide users with more contextual information and improved response quality.
- ✅ Research indicates that utilizing Knowledge Graphs in combination with vector searches leads to significantly higher response accuracy in applications.
- 🚀 Once a Knowledge Graph is established, developing applications becomes easier, particularly for enterprises dealing with structured data.
- 🔍 The explicit nature of Knowledge Graphs enhances explainability, auditability, and governance in applications, making it easier to justify algorithmic decisions.
- 🌐 The creation of Knowledge Graphs from unstructured data remains challenging, but new tools like the Knowledge Graph Builder simplify the process.
- 👨💻 A demonstration showcased how to create a Knowledge Graph from diverse data sources, visualizing the interconnected relationships effectively.
Q & A
What is the main focus of the speaker's professional life?
-The speaker is dedicated to helping developers build better applications by leveraging relationships between individual data points rather than just relying on single data points.
How did the evolution of search technology begin in the mid-90s?
-In the mid-90s, numerous web search companies utilized keyword-based text search technologies, which initially worked well but later became overwhelmed by the volume of search results, leading to the 'Alav Vista effect.'
What was the 'Alav Vista effect'?
-The 'Alav Vista effect' refers to the problem of receiving an overwhelming number of search results that made it difficult for users to find relevant information.
What innovation did Google introduce to improve search results?
-Google introduced the PageRank algorithm, a graph algorithm that ranks web pages based on the quality and quantity of links to them, allowing for more relevant search results.
What is the Knowledge Graph, and how did it change Google's search technology?
-The Knowledge Graph is a technology that moved beyond text and links to include the relationships and concepts within documents, enhancing the search experience by providing structured information.
What does 'graph rag' refer to?
-Graph rag refers to a retrieval augmented generation (RAG) approach where a Knowledge Graph is used in the retrieval path, potentially in combination with other technologies like vector search.
What are the benefits of using graph rag for applications?
-The benefits include higher accuracy of responses, easier development of applications, and increased explainability and governance due to the explicit data structure of Knowledge Graphs.
What challenges exist in creating a Knowledge Graph?
-Creating a Knowledge Graph can be challenging, especially when dealing with unstructured data. However, once established, it significantly eases the development of applications.
What types of data are important when creating a Knowledge Graph?
-Three important types of data for Knowledge Graph creation are structured data (like databases), unstructured data (like PDF files), and mixed data (structured data with long-form text).
What tool did the speaker demonstrate for creating Knowledge Graphs?
-The speaker demonstrated the Knowledge Graph Builder, a tool that allows users to upload various types of documents and automatically create a Knowledge Graph from the extracted data.
Outlines

This section is available to paid users only. Please upgrade to access this part.
Upgrade NowMindmap

This section is available to paid users only. Please upgrade to access this part.
Upgrade NowKeywords

This section is available to paid users only. Please upgrade to access this part.
Upgrade NowHighlights

This section is available to paid users only. Please upgrade to access this part.
Upgrade NowTranscripts

This section is available to paid users only. Please upgrade to access this part.
Upgrade Now


5.0 / 5 (0 votes)