MINI-LESSON 5: Correlation, the intuition. Doesn't mean what people usually think it means.
Summary
TLDRThis lecture delves into the complexities and misconceptions surrounding the concept of correlation. It clarifies that correlation does not necessarily reflect the dependence between variables, using examples to illustrate how it can be misleading, especially in non-linear relationships. The speaker emphasizes the limitations of correlation, such as its inability to account for noise and its non-additive nature. The lecture advocates for the use of mutual information as a more powerful metric for capturing true associations between variables, providing a visual representation to better understand the information content conveyed by different correlation values.
Takeaways
- 🧐 Correlation is often misunderstood and does not reflect the true dependence between variables.
- 📊 The formula for calculating correlation involves the expectation of the product of the deviations from the mean of x and y, normalized by the square root of their variances.
- 📉 Correlation can be misleading, as it can be zero even when there is a strong relationship between variables, as shown in the example where y equals x or -x depending on the sign of x.
- 📈 Mutual information is a more powerful metric that can capture the true dependence between variables, unlike correlation.
- 🔍 Correlation works best in simple linear models where the relationship between variables is direct and proportional.
- 📊 Correlation is not additive; the local correlations in different quadrants of a graph may not sum up to the overall correlation.
- 🚫 Correlation is not suitable for complex, non-linear relationships commonly found in real-life scenarios.
- 🤔 The perception of correlation values can be deceptive; for example, a correlation of 0.25 is much closer to zero than to 0.5 in terms of actual information content.
- 📚 The transcript emphasizes the importance of visual representation, such as graphs, in understanding the implications of correlation and other statistical measures.
- 📈 For Gaussian distributions, there is a direct formula to calculate mutual information from correlation, but for non-Gaussian distributions, it must be computed individually.
- 💡 The speaker suggests that mutual information, based on entropy and logarithms, is a more informative measure connected to the Kelly criterion, which is used in betting and decision-making.
Q & A
What does the speaker claim about the general understanding of correlation?
-The speaker claims that few people truly understand what correlation is, and many who think they do, actually do not know what it means.
What is the formula for calculating correlation mentioned in the script?
-The formula for calculating correlation is the expectation of (x - mean of x) * (y - mean of y) divided by the square root of the variance of x times the variance of y.
Why does the speaker say that correlation does not reflect dependence between variables?
-The speaker argues that correlation does not reflect dependence because it only measures the linear relationship between variables, and does not account for non-linear relationships or noise in the data.
What is the example given to illustrate that correlation does not reflect dependence?
-The example given is a situation where y equals x below zero and y equals -x above zero. Despite a clear non-linear relationship and dependence, the correlation (rho) between x and y is zero.
What is the alternative metric suggested to better understand dependence between variables?
-The alternative metric suggested is mutual information, which is said to provide a more powerful and accurate measure of dependence.
Why does the speaker say that correlation is not additive?
-The speaker explains that correlation is not additive because the local correlations in different quadrants do not sum up to the overall correlation. This is demonstrated with an example where the overall correlation is 0.5, but the local correlations in each quadrant are different.
What is the speaker's opinion on the use of correlation in IQ studies?
-The speaker believes that IQ studies are generally either complete or partial nonsense when they rely on correlation, as correlation is not a reliable measure for non-linear relationships.
What is the correlation triangle mentioned by the speaker, and what does it represent?
-The correlation triangle is a concept used by option traders to understand the relationships between different assets. It represents the idea that a correlation between two assets does not necessarily imply a correlation between a third asset.
Why does the speaker suggest that visual representation can help in understanding correlation better?
-The speaker suggests that visual representation, such as graphs, can help because people often understand the implications of data better when they can see it visually, rather than just being given numerical metrics.
How does the speaker describe the relationship between mutual information and the Kelly criterion?
-The speaker describes mutual information as an entropy-based measure that is closely connected to the Kelly criterion because it is based on logs, which indicate how much one would be willing to bet on an outcome based on the information available.
What is the formula for mutual information for a Gaussian distribution mentioned in the script?
-For a Gaussian distribution, the formula for mutual information is the log of 1 plus the correlation, minus one half the log of 1 minus the square of the correlation.
Outlines

Этот раздел доступен только подписчикам платных тарифов. Пожалуйста, перейдите на платный тариф для доступа.
Перейти на платный тарифMindmap

Этот раздел доступен только подписчикам платных тарифов. Пожалуйста, перейдите на платный тариф для доступа.
Перейти на платный тарифKeywords

Этот раздел доступен только подписчикам платных тарифов. Пожалуйста, перейдите на платный тариф для доступа.
Перейти на платный тарифHighlights

Этот раздел доступен только подписчикам платных тарифов. Пожалуйста, перейдите на платный тариф для доступа.
Перейти на платный тарифTranscripts

Этот раздел доступен только подписчикам платных тарифов. Пожалуйста, перейдите на платный тариф для доступа.
Перейти на платный тариф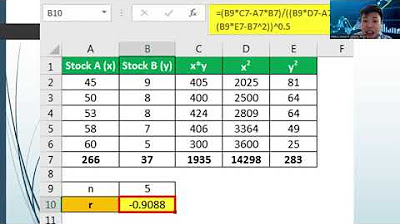


5.0 / 5 (0 votes)
