Pedigree for determining probability of exhibiting sex linked recessive trait | Khan Academy

Khan Academy
3 May 201805:19

Summary

TLDRThe video script explains the inheritance of color blindness through a pedigree chart, using symbols to represent gender and the trait. It details how to deduce the genotypes of Tom and Barbara, a couple with a colorblind son. By analyzing the family's genetic makeup, the instructor calculates the probability of their next child being colorblind as 50%, using a Punnett square to illustrate the possible genetic outcomes.

Takeaways

  • 🔍 The video discusses a pedigree chart representing the inheritance of color blindness through three generations.
  • 👦 The standard convention in the chart is that a square represents a male, and a circle represents a female.
  • 🌈 If a symbol is colored in, it indicates that the individual exhibits the trait, specifically color blindness in this context.
  • 🌟 Color blindness is identified as an X-linked recessive trait, meaning it is more likely to affect males due to the way it is inherited.
  • 🤔 The probability of Barbara's next child being colorblind is the main question posed in the video.
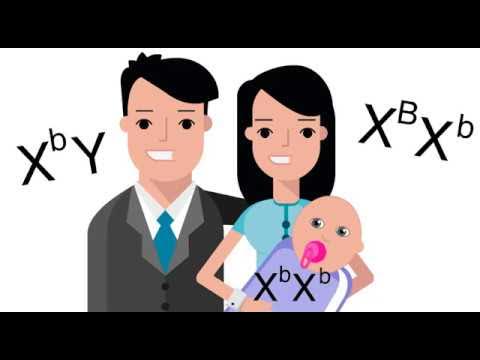
  • 👨 Tom, being male and colorblind, has the genotype XcY, where 'c' represents the colorblind allele.
  • 👩 Barbara, being female, has two X chromosomes, and her genotype can be deduced from her parents' genotypes.
  • 👴 Bill, Barbara's father, must have passed on an X chromosome with the colorblind allele, as he is colorblind.
  • 👵 Bonnie, Barbara's mother, could either be a carrier (XcX) or not a carrier (XX), but she does not exhibit color blindness.
  • 👶 Barbara's genotype is XcX+, indicating she is a carrier of the colorblind allele but does not exhibit the trait.
  • 📊 Using a Punnett square, the possible outcomes for Barbara and Tom's offspring are calculated, showing a 50% chance of their child being colorblind.

Q & A

  • What is the purpose of the pedigree chart in the script?

    -The pedigree chart in the script is used to represent the inheritance of color blindness through three generations.

  • What are the symbols used in the chart to represent males and females?

    -In the chart, a square symbol represents a male, and a circle represents a female.

  • How is color blindness indicated on the chart?

    -Color blindness is indicated by coloring in the symbol for an individual, showing that they exhibit the trait.

  • What is the significance of Tom's genotype in the script?

    -Tom's genotype is significant because he is colorblind, which means his single X chromosome must carry the recessive allele for color blindness.

  • Why can't both of Barbara's X chromosomes have the recessive allele for color blindness?

    -If both of Barbara's X chromosomes had the recessive allele for color blindness, she would exhibit the trait, but she does not, indicating she is a carrier with at least one dominant allele.

  • How did Barbara inherit her X chromosomes?

    -Barbara inherited one X chromosome from her father, which must have the colorblind allele, and one from her mother, which does not have the colorblind allele.

  • What is the probability that Barbara and Tom's next child will be colorblind, according to the script?

    -The probability that Barbara and Tom's next child will be colorblind is 50%, as two out of the four possible genetic outcomes result in color blindness.

  • What is the Punnett square used for in the script?

    -The Punnett square is used to visualize the possible genetic outcomes for their offspring, showing the combinations of alleles they can inherit from each parent.

  • What does the lowercase 'c' represent in the script?

    -In the script, the lowercase 'c' represents the recessive allele for color blindness.

  • How many scenarios result in a colorblind offspring in the script's Punnett square?

    -Two out of the four scenarios in the Punnett square result in a colorblind offspring.

  • What are the four possible outcomes for the offspring of Barbara and Tom, as described in the script?

    -The four possible outcomes are: a colorblind female with two recessive alleles, a female carrier with one recessive and one dominant allele, a colorblind male with the recessive allele on his only X chromosome, and a non-colorblind male with a dominant allele on his only X chromosome.

Outlines

00:00

🧬 Understanding Color Blindness Inheritance

This paragraph discusses the inheritance of color blindness using a pedigree chart. It explains the standard convention where squares represent males and circles represent females, with filled shapes indicating the presence of a trait. Color blindness is identified as an X-linked recessive trait. The focus is on determining the probability of Barbara's next child being colorblind. The instructor guides through the process of deducing the genotypes of Tom and Barbara based on their family's phenotypes. It is established that Tom is colorblind (XcY), and Barbara is likely a carrier (XcX+). The paragraph concludes with the creation of a Punnett square to visualize the possible genetic outcomes for their offspring, highlighting the 50% chance of a child being colorblind.

05:01

🔍 Calculating the Probability of Color Blindness

In this paragraph, the focus is on calculating the probability of Barbara and Tom's next child being colorblind. The instructor uses a Punnett square to illustrate the four possible genetic combinations of their offspring. The outcomes include a colorblind female (XcXc), a female carrier (XcX+), a colorblind male (XcY), and a non-colorblind male (X+Y). The paragraph emphasizes that two out of the four scenarios result in colorblind offspring, leading to a 50% probability that their next child will be colorblind.

Mindmap

Keywords

💡Pedigree chart

A pedigree chart is a diagram used to represent the inheritance of traits across generations within a family. In the context of the video, it is used to illustrate the inheritance of color blindness through three generations, with squares representing males and circles representing females, and filled shapes indicating the presence of the trait.

💡Color blindness

Color blindness is a genetic condition where an individual has difficulty distinguishing certain colors. It is relevant to the video's theme as the main trait being discussed and inherited through the family in the pedigree chart.

💡X-linked recessive trait

X-linked recessive traits are genetic traits that are carried on the X chromosome and only manifest when two copies of the recessive allele are present. In the video, color blindness is described as an X-linked recessive trait, meaning that it is more common in males, who have only one X chromosome.

💡Phenotype

Phenotype refers to the observable characteristics of an individual, which result from the interaction of its genotype with the environment. The video explains that Bill's phenotype is color blind, indicating that he exhibits the trait of color blindness.

💡Genotype

Genotype is the genetic makeup of an individual, describing the specific set of genes inherited from the parents. In the script, determining the genotypes of Tom and Barbara is crucial to understanding the probability of their offspring being colorblind.

💡Dominant and recessive alleles

Dominant alleles are versions of a gene that express their effect even when only one copy is present, while recessive alleles require two copies to be expressed. The video explains that the non-colorblind allele is dominant (represented by a plus), and the colorblind allele is recessive (represented by lowercase 'c').

💡Carrier

A carrier is an individual who has a recessive allele for a trait but does not express the trait because they also have a dominant allele. The video discusses the possibility of Bonnie being a carrier for color blindness, meaning she has one colorblind allele but does not exhibit the trait.

💡Punnett square

A Punnett square is a diagram used to predict the genotypes of offspring based on the genotypes of the parents. In the video, a Punnett square is used to determine the possible genetic outcomes for Tom and Barbara's children, showing the probability of color blindness.

💡Probability

Probability is the measure of the likelihood that a particular event will occur. The video concludes with calculating the probability of Barbara and Tom's next child being colorblind, using the Punnett square to determine the likelihood.

💡Inheritance

Inheritance in genetics refers to the passing of traits from parents to offspring. The video's main theme revolves around the inheritance of color blindness, explaining how the trait is passed down through generations.

💡Chromosomes

Chromosomes are thread-like structures made of DNA and protein found in the nucleus of cells, carrying genetic information. The video explains that males have one X and one Y chromosome, while females have two X chromosomes, which is key to understanding X-linked inheritance.

Highlights

The video discusses a pedigree chart representing the inheritance of color blindness across three generations.

Standard convention in pedigree charts: squares represent males, circles represent females, and filled shapes indicate the expression of a trait.

Color blindness is identified as an X-linked recessive trait in the provided chart.

The task is to calculate the probability of Barbara's next child being colorblind.

Tom's genotype is deduced as XcY, indicating he is colorblind.

Barbara's genotype is inferred by examining her parents' genotypes and her phenotype.

Bill's genotype is XcY, similar to Tom's, confirming he exhibits color blindness.

Bonnie's genotype is uncertain, but it's known she does not exhibit color blindness.

Barbara must have one X chromosome with the dominant allele from her mother and one with the recessive allele from her father.

Barbara is identified as a carrier of the colorblind allele.

Tom can contribute either an X chromosome with the colorblind allele or a Y chromosome.

Barbara can contribute either an X chromosome with the colorblind allele or a non-colorblind allele.

A Punnett square is used to visualize the possible genetic outcomes of their offspring.

There are four equally likely genetic outcomes for Tom and Barbara's children.

Two of the four outcomes result in colorblind offspring, one male and one female.

The probability of their next child being colorblind is calculated to be 50%.

Transcripts

play00:00

- [Instructor] We are told the pedigree chart

play00:01

represents the inheritance of color blindness

play00:04

through three generations.

play00:05

And we see this here.

play00:06

The standard convention is a square

play00:08

is male, circle is female.

play00:11

If it's colored in, that means that they exhibit the trait,

play00:13

in this case it's color blindness.

play00:15

So Bill exhibits color blindness.

play00:17

His phenotype is color blind,

play00:19

while Bonnie does not exhibit color blindness.

play00:22

Color blindness is an X-linked recessive trait.

play00:26

If Barbara is expecting another child,

play00:28

so this is Barbara right here,

play00:30

what is the probability that it will be colorblind?

play00:34

So pause this video and see if you can

play00:35

figure that out on your own.

play00:37

All right, now let's work through this together.

play00:40

So they're asking us about their next child here.

play00:43

What is the probability that it is going to be colorblind?

play00:46

And to help us with that,

play00:47

we can try to figure out the genotypes of Tom and Barbara.

play00:51

So Tom is pretty straightforward.

play00:53

He is male, we know that 'cause there's a square there.

play00:56

So X, he has an X chromosome and he has a Y chromosome.

play01:00

And color blindness is an X-linked recessive trait.

play01:04

And so let me just make clear what's going on.

play01:06

So I'll do lowercase C for colorblind, colorblind.

play01:11

And I could do a capital C for the dominant trait,

play01:14

which is not colorblind,

play01:16

but since they look so similar,

play01:17

I'll just use a plus for not colorblind,

play01:21

not color, not colorblind.

play01:24

And so Tom, his phenotype, he is colorblind,

play01:28

and he only has one X chromosome,

play01:31

what the colorblind trait is linked to.

play01:34

And so that must have the recessive allele right over there.

play01:37

So this is Tom's genotype.

play01:39

But what about Barbara?

play01:41

Well, we know Barbara's going to have

play01:42

two X chromosomes because Barbara is female.

play01:45

And we know that both of them can't be lowercase C

play01:49

because then Barbara would exhibit color blindness,

play01:51

but how can we figure out her actual genotype?

play01:54

Well, we could look at her parents.

play01:56

So Bill over here is going to have

play01:58

the same genotype as Tom,

play02:01

at least with respect to color blindness.

play02:03

He is male, so he has an X chromosome and a Y chromosome.

play02:07

And because he exhibits color blindness,

play02:09

that X chromosome must have the recessive

play02:12

colorblind allele associated with it.

play02:15

Now, Bonnie, we do not know.

play02:17

She will be XX, will have two X chromosomes.

play02:21

Like Barbara, we know that both of these

play02:23

can't have the recessive allele

play02:25

because then Bonnie would be filled in,

play02:27

she would exhibit color blindness.

play02:28

But we don't know whether she is a carrier

play02:32

or whether she isn't.

play02:33

But let's just think about where

play02:34

Barbara got her chromosomes from.

play02:37

One of her X chromosomes comes from her father.

play02:41

And the other one comes from her mother.

play02:43

So if she got this X chromosome from her father,

play02:46

her father only has one X chromosome to give,

play02:48

the one that has the colorblind allele.

play02:51

So if this is from her father,

play02:53

it must have the colorblind allele here.

play02:55

And we know that the one from her mother

play02:58

does not the colorblind allele

play02:59

because if it was like this,

play03:01

then Barbara would be colorblind, and she isn't.

play03:03

So we know that this must be a plus here.

play03:05

It is the dominant non-colorblind allele.

play03:08

And so now we know both of their genotypes

play03:11

and we can use those to then figure out

play03:13

the possible outcomes for their offspring.

play03:16

So for example, Tom can contribute

play03:21

a X chromosome that has a colorblind allele,

play03:24

or a Y chromosome.

play03:26

And Barbara, right over here,

play03:29

can contribute an X chromosome

play03:31

that has the colorblind allele,

play03:33

or an X chromosome that has the non-colorblind allele.

play03:37

Barbara is a carrier.

play03:39

And so let me just draw a little Punnett square here.

play03:43

And so we have four possible outcomes for their children

play03:47

and they're all equally likely.

play03:49

So you can get the X chromosome from Barbara

play03:55

that has the colorblind allele

play03:57

and the X chromosome from Tom

play04:00

that has the colorblind allele.

play04:02

You could have the X chromosome

play04:05

from Barbara with the colorblind allele,

play04:07

and the Y chromosome from Tom.

play04:11

You could have the non-colorblind X chromosome

play04:17

that does not have the colorblind allele on it,

play04:21

and get the colorblind X chromosome from Tom.

play04:27

Or you could have the non-colorblind X chromosome

play04:31

and the Y chromosome from the father.

play04:35

So there's four equal scenarios.

play04:38

And so in how many of these scenarios

play04:39

is the offspring colorblind?

play04:42

Well, here we have a colorblind female.

play04:45

She has two of the recessive alleles,

play04:49

so that female will be colorblind.

play04:51

This is a female carrier,

play04:53

but they will not show the phenotype of being colorblind.

play04:56

This over here is a colorblind male,

play04:59

has only one X chromosome

play05:00

and it has the colorblind allele on it.

play05:04

And this is a non-colorblind male.

play05:07

So out of four equal outcomes,

play05:09

two of them have the offspring being colorblind.

play05:11

So two out of four, that would be a 50% probability

play05:15

that the offspring will be colorblind.

Rate This

5.0 / 5 (0 votes)

Связанные теги
GeneticsColor BlindnessPedigree ChartX-linked RecessiveInheritanceGenotypePhenotypeCarrierProbabilityFamily Traits
Вам нужно краткое изложение на английском?