Komparasi Kategorik Part 2
Summary
TLDRThis video tutorial provides an in-depth exploration of statistical methods for data analysis, focusing on nonparametric tests such as McNemar's, Wilcoxon, and Kruskal-Wallis. It emphasizes the importance of comparing categorical and numerical data and guides viewers through practical steps for analyzing and interpreting results. The session covers essential concepts, such as testing proportions, analyzing frequency distributions, and transforming categorical variables, offering useful tips for applying these techniques in research, especially in health-related studies. By following along, viewers can improve their ability to perform statistical comparisons effectively.
Takeaways
- 📊 McNemar test is used for paired categorical data, especially when comparing two related measurements (e.g., before vs after treatment).
- 🔢 Wilcoxon test is used for paired numerical data comparisons, while McNemar is specifically for categorical variables.
- 🧪 Both McNemar and Cochran’s Q tests are nonparametric tests, similar in concept to tests like Mann-Whitney and Kruskal-Wallis.
- 🔁 McNemar is applied when there are two related groups, while Cochran’s Q is used when there are more than two repeated measurements.
- 📉 These tests are commonly used in pre-post study designs, such as comparing patient status before and after treatment.
- 🖱️ In SPSS, McNemar test can be accessed via Analyze → Descriptive Statistics → Crosstabs, then selecting the McNemar option.
- 📋 Frequency tables help summarize how many subjects changed categories between two time points.
- ⚖️ The interpretation focuses on whether there is a significant difference in proportions between paired observations.
- 🧠 Understanding and practicing these statistical tests is key, as they may seem complex but become easier with application.
- 📊 Chi-square analysis can be extended with risk estimation (e.g., odds ratio) in 2x2 tables to interpret likelihoods between groups.
- 📈 Risk estimates (like odds ratios) explain how much more likely an outcome is in one group compared to another.
- 🔄 Re-coding variables allows transformation of categorical data (e.g., reducing from three categories to two) for analysis purposes.
- 🛠️ In SPSS, recoding is done by transforming variables and assigning new category values to simplify analysis.
- 📚 Overall, selecting the correct statistical test depends on data type (categorical vs numerical) and whether samples are paired or independent.
Q & A
What is McNemar's test used for?
-McNemar's test is used for comparing paired categorical data, typically in 'before and after' studies. It helps determine if there is a significant difference in proportions between two paired groups, such as comparing the health status of patients before and after a treatment.
What is the primary difference between McNemar's test and Wilcoxon signed-rank test?
-McNemar's test is used for categorical data, while the Wilcoxon signed-rank test is used for paired ordinal or continuous data that is not normally distributed. Both are non-parametric tests, but they apply to different types of data.
How is the Kruskal-Wallis test different from ANOVA?
-The Kruskal-Wallis test is a non-parametric alternative to ANOVA, used for comparing more than two groups when the data is ordinal or not normally distributed. ANOVA, on the other hand, assumes that the data is normally distributed and is used for comparing means across groups.
What does a Chi-Square test in a 2x2 table analyze?
-In a 2x2 table, the Chi-Square test is used to analyze the relationship between two categorical variables. It determines whether there is a significant association between the variables, such as comparing smoking habits and the likelihood of having a bicycle.
What is the purpose of recoding categories in statistical analysis?
-Recoding categories in statistical analysis allows you to simplify or merge different categories into fewer ones. This is useful when dealing with variables that have too many categories, making the analysis easier and more interpretable.
How does one conduct a McNemar test in statistical software like SPSS?
-In SPSS, to conduct a McNemar test, you input the frequency data, ensuring the variable of interest is categorical. Then, you select the McNemar test from the statistical menu, analyze the output, and interpret the p-value to determine if there's a significant difference between the paired groups.
What type of data is appropriate for a Wilcoxon signed-rank test?
-The Wilcoxon signed-rank test is appropriate for paired ordinal or continuous data that is not normally distributed. It is often used when comparing two related samples or matched pairs.
Can the Chi-Square test be used for non-categorical data?
-No, the Chi-Square test is specifically used for categorical data. If the data is continuous or ordinal, other tests like the t-test or Kruskal-Wallis test are more appropriate.
What is an odds ratio (OR) in a Chi-Square test and how is it interpreted?
-An odds ratio (OR) in a Chi-Square test is a measure of association that compares the odds of an event occurring in one group relative to another. An OR greater than 1 suggests a higher likelihood of the event in the first group, while an OR less than 1 suggests a lower likelihood.
Why is practice important when learning to perform statistical analyses?
-Practice is crucial because it helps solidify understanding of statistical tests and their applications. The more you work with data and use various tests like McNemar’s, Wilcoxon, and Chi-Square, the more comfortable you become with interpreting results and choosing the correct tests for different situations.
Outlines

Этот раздел доступен только подписчикам платных тарифов. Пожалуйста, перейдите на платный тариф для доступа.
Перейти на платный тарифMindmap

Этот раздел доступен только подписчикам платных тарифов. Пожалуйста, перейдите на платный тариф для доступа.
Перейти на платный тарифKeywords

Этот раздел доступен только подписчикам платных тарифов. Пожалуйста, перейдите на платный тариф для доступа.
Перейти на платный тарифHighlights

Этот раздел доступен только подписчикам платных тарифов. Пожалуйста, перейдите на платный тариф для доступа.
Перейти на платный тарифTranscripts

Этот раздел доступен только подписчикам платных тарифов. Пожалуйста, перейдите на платный тариф для доступа.
Перейти на платный тарифПосмотреть больше похожих видео
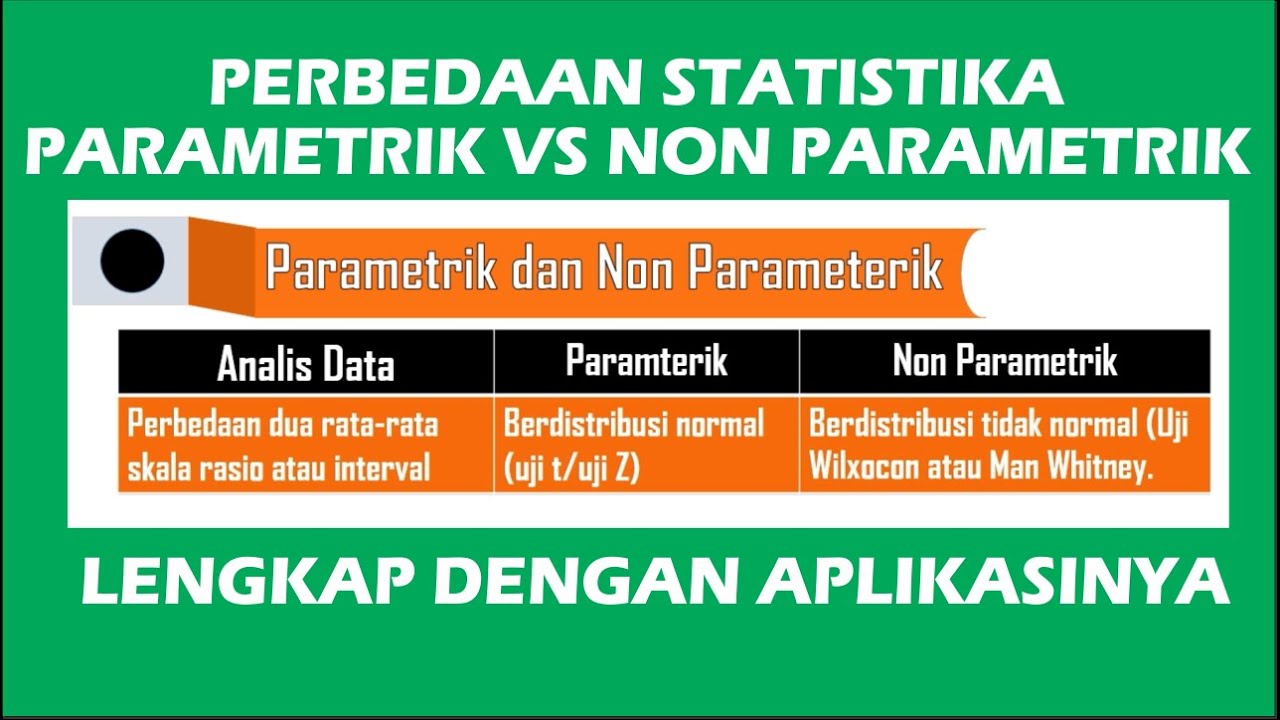
Perbedaan Statistika Parametrik dan Non Parametrik
Statistika Non Parametrik

Wilcoxon: Uji Non-Parametrik Komparasi Numerik Tidak Berpasangan
One Way ANOVA (Analysis of Variance): Introduction | Statistics Tutorial #25 | MarinStatsLectures
KONSEP DASAR UJI BEDA MEAN | BERPASANGAN VS TIDAK BERPASANGAN ❓❓❓❓

Kruskal Wallis: Uji Non-Parametrik Komparasi Numerik Tidak Berpasangan
5.0 / 5 (0 votes)
