Apa itu Kurva Normal?
Summary
TLDRThis video provides an in-depth explanation of the normal distribution curve in statistics. It begins by differentiating between parametric and nonparametric methods, explaining that parametric analysis is used when data follows a normal distribution, while nonparametric methods apply to non-normal or outlier-containing data. The instructor details the characteristics of the normal curve, including its bell shape, symmetry around the mean, median, and mode, and the impact of variance on its width. Concepts like probability density functions, asymptotic behavior, and the calculation of area under the curve are introduced. Practical examples, such as analyzing monthly income data, illustrate how to apply these concepts effectively.
Takeaways
- 😀 Introduction to Normal Distribution: The video discusses the concept of normal distribution, which is a core topic in statistics.
- 😀 Statistical Methods Overview: The lecturer explains the two primary statistical methods: parametric and non-parametric methods, and how they differ based on data distribution.
- 😀 When to Use Parametric vs Non-Parametric: If the data follows a normal distribution, the parametric method is used. Otherwise, the non-parametric method is applied.
- 😀 Importance of Data Sample Size: For a dataset to be considered normal, a minimum of 30 data points is required for proper analysis.
- 😀 Role of Outliers: If a dataset contains outliers or skewed data, it may require the use of non-parametric methods for analysis.
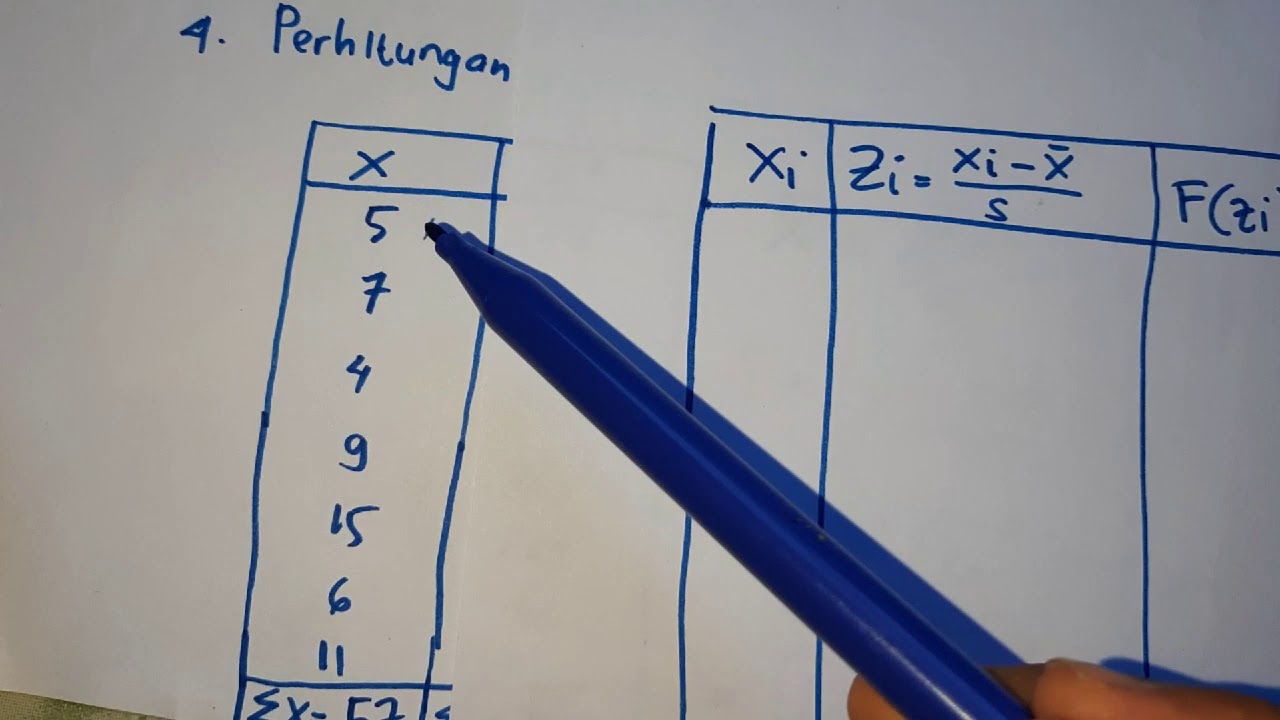
- 😀 Identifying Skewed Data: The lecturer uses an example of monthly income data to explain how to detect skewed data that may require transformation.
- 😀 Visualizing Normal Distribution: The normal distribution is illustrated with a bell curve, showing that the mean, median, and mode are at the center of the curve.
- 😀 Symmetry of the Normal Curve: The normal curve should be symmetrical, with the left and right sides being identical in shape.
- 😀 Variance Impact on Curve Shape: The spread of the curve depends on the variance; higher variance results in a wider curve.
- 😀 Understanding Asymptotic Behavior: The normal curve never intersects the horizontal axis, a property called asymptotic behavior, which means the curve never reaches zero.
Q & A
What is a normal distribution in statistics?
-A normal distribution is a type of distribution where data is symmetrically distributed around the mean, forming a bell-shaped curve. The mean, median, and mode all occur at the center of the curve.
What are the two types of statistical methods mentioned in the video?
-The two types of statistical methods are parametric and non-parametric methods. Parametric methods are used when data follows a normal distribution, while non-parametric methods are used when the data does not follow a normal distribution.
When should you use parametric methods in statistical analysis?
-Parametric methods should be used when the data follows a normal distribution, which is typically true for larger sample sizes (usually greater than 30 data points).
What determines whether we use parametric or non-parametric methods?
-The choice between parametric and non-parametric methods depends on the distribution of the data. If the data follows a normal distribution, parametric methods are used. If the data does not follow a normal distribution, non-parametric methods are applied.
How can you identify if data follows a normal distribution?
-Data can be considered normally distributed if it has a large enough sample size (usually more than 30), and the data does not contain outliers or extreme deviations from the mean.
What is the significance of outliers in statistical analysis?
-Outliers can affect the normality of data. If there are significant outliers, the data may no longer follow a normal distribution, and non-parametric methods may be more appropriate.
What is the shape of a normal distribution curve?
-The normal distribution curve is bell-shaped and symmetrical. The peak of the curve occurs at the mean (μ), and it tapers off as it approaches the horizontal axis, never touching it (asymptotic).
What happens to the shape of the normal distribution curve as the variance increases?
-As the variance increases, the normal distribution curve becomes wider and shorter. Conversely, smaller variance results in a taller and narrower curve.
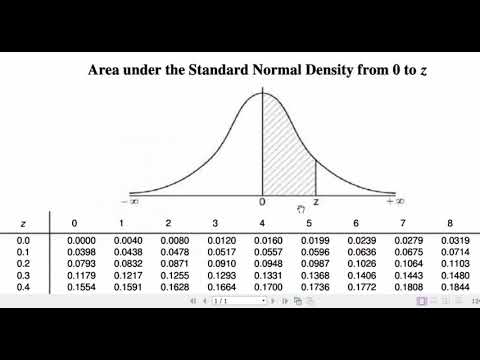
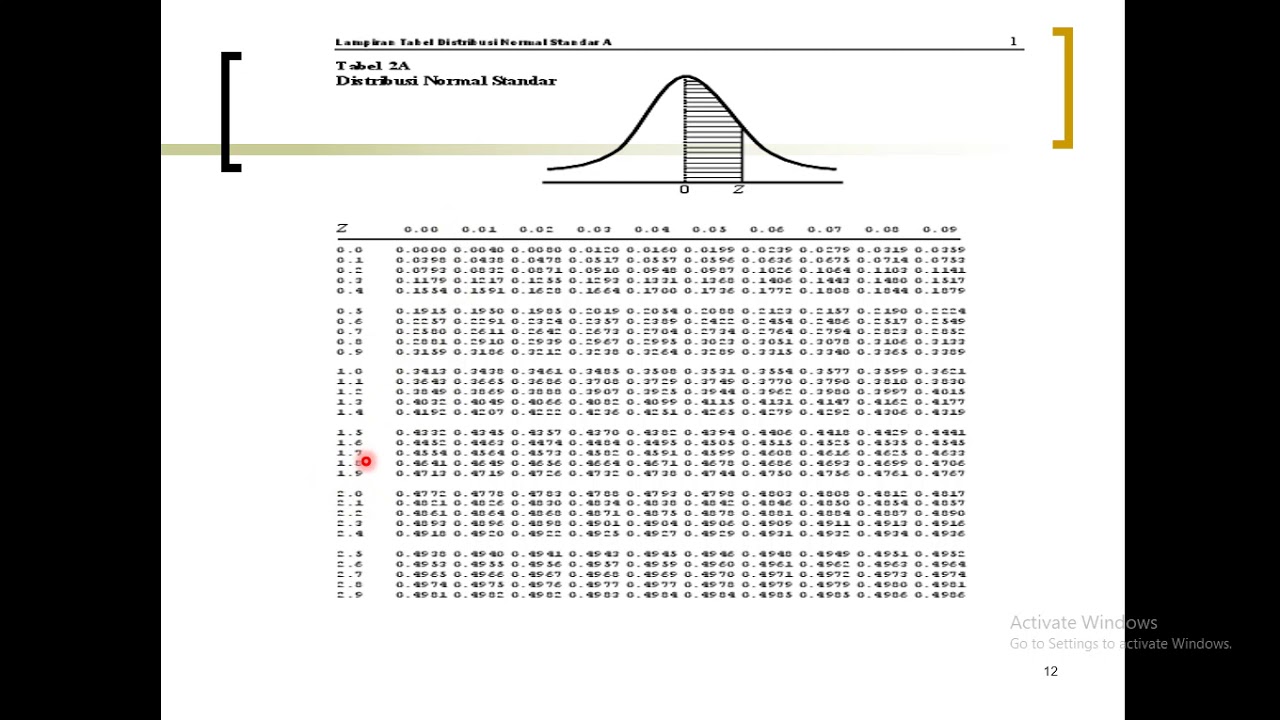
What does the area under the normal distribution curve represent?
-The area under the normal distribution curve represents probabilities. The total area under the curve is equal to 1, and different sections of the curve correspond to different probabilities.
How are the mean, median, and mode related in a normal distribution?
-In a normal distribution, the mean, median, and mode all lie at the center of the curve, meaning they are equal and the distribution is perfectly symmetrical.
Outlines

Этот раздел доступен только подписчикам платных тарифов. Пожалуйста, перейдите на платный тариф для доступа.
Перейти на платный тарифMindmap

Этот раздел доступен только подписчикам платных тарифов. Пожалуйста, перейдите на платный тариф для доступа.
Перейти на платный тарифKeywords

Этот раздел доступен только подписчикам платных тарифов. Пожалуйста, перейдите на платный тариф для доступа.
Перейти на платный тарифHighlights

Этот раздел доступен только подписчикам платных тарифов. Пожалуйста, перейдите на платный тариф для доступа.
Перейти на платный тарифTranscripts

Этот раздел доступен только подписчикам платных тарифов. Пожалуйста, перейдите на платный тариф для доступа.
Перейти на платный тарифПосмотреть больше похожих видео


5.0 / 5 (0 votes)
