Tutorial-18: Probing Intermediate Nodes and Managing Noise Floor
Summary
TLDRIn this tutorial, we explore how to probe intermediate nodes in your RS system designs and manage noise floor display in plots. The session builds on prior lessons, demonstrating how to probe specific system points like mixer outputs and filters using SystemVue's default features. The tutorial also covers the impact of resolution bandwidth on noise floor levels and how to adjust them for clearer results. By the end, viewers will learn how to visualize and control noise floors, enhance system probing, and improve data analysis efficiency in system simulations.
Takeaways
- 😀 Probing intermediate nodes in your RF system design allows you to visualize data at various stages, such as after the mixer or filter.
- 😀 No need to predefine wire labels or probes in SystemVue, as it automatically saves data at each node before simulation.
- 😀 You can easily add new graphs to display data at different nodes, such as the mixer output or filter output, to compare their performance.
- 😀 Organizing your graphs with clear and consistent naming conventions (e.g., 'Mixer Output' or 'Filter Output') improves clarity and efficiency.
- 😀 Tiling graphs vertically or side by side allows you to directly compare the effects of components like mixers and filters on your system.
- 😀 The noise floor in your plots is influenced by the resolution bandwidth (RBW), which can be adjusted to control noise visibility.
- 😀 Lowering the measurement bandwidth reduces the noise floor, making the results clearer by filtering out unwanted noise.
- 😀 Unlike physical spectrum analyzers, SystemVue continues to show spurious products even when they fall below the noise floor, offering a more detailed view.
- 😀 Adjusting the X-axis scale (e.g., to gigahertz) helps to better display the data and avoid text overlap on the graph.
- 😀 Managing the noise floor is essential to preventing interference with signal analysis and ensuring accurate simulation results.
- 😀 SystemVue's ability to probe data at multiple intermediate points without needing to define measurement points beforehand simplifies the process and saves time.
Q & A
What is the main focus of Tutorial 18 in the video?
-The main focus of Tutorial 18 is probing intermediate nodes in RS system designs and managing the noise floor display in plots.
How does the tutorial suggest probing intermediate nodes in the RS system design?
-The tutorial suggests right-clicking on specific nodes, such as the mixer or filter, and selecting 'add new graph' to plot the data for those nodes.
What is the role of the 'output tab' mentioned in the video?
-The 'output tab' by default saves the data at every node in the system, which eliminates the need to manually define where to take measurements before simulation.
What happens when you right-click on a node in the mixer in the system design?
-Right-clicking on a node in the mixer gives the option to add a new power plot graph, which will display the power data at that node.
How can the results of the mixer and filter nodes be compared in the system?
-By adding power plots for both the mixer and filter nodes, you can tile the graphs vertically to compare the results side by side.
Why is it important to rename the graphs and nodes in the system?
-Renaming graphs and nodes helps maintain clear organization and makes it easier to understand and interpret the simulation results.
What is the reason for seeing two noise floors in the simulation?
-The two noise floors are due to the thermal noise and the resolution bandwidth settings in the system, which affect the noise floor level in the plots.
How can the noise floor be controlled in the simulation?
-The noise floor can be controlled by adjusting the resolution bandwidth or the measurement bandwidth in the system, which affects the noise level displayed.
What happens to the noise floor when the measurement bandwidth is reduced?
-When the measurement bandwidth is reduced, the noise floor decreases, as seen when the resolution bandwidth is adjusted in the simulation.
What is a key feature of SystemVue related to the noise floor?
-A key feature of SystemVue is that it still displays products below the noise floor, unlike many instruments that mask data below the noise floor.
Outlines

Этот раздел доступен только подписчикам платных тарифов. Пожалуйста, перейдите на платный тариф для доступа.
Перейти на платный тарифMindmap

Этот раздел доступен только подписчикам платных тарифов. Пожалуйста, перейдите на платный тариф для доступа.
Перейти на платный тарифKeywords

Этот раздел доступен только подписчикам платных тарифов. Пожалуйста, перейдите на платный тариф для доступа.
Перейти на платный тарифHighlights

Этот раздел доступен только подписчикам платных тарифов. Пожалуйста, перейдите на платный тариф для доступа.
Перейти на платный тарифTranscripts

Этот раздел доступен только подписчикам платных тарифов. Пожалуйста, перейдите на платный тариф для доступа.
Перейти на платный тарифПосмотреть больше похожих видео
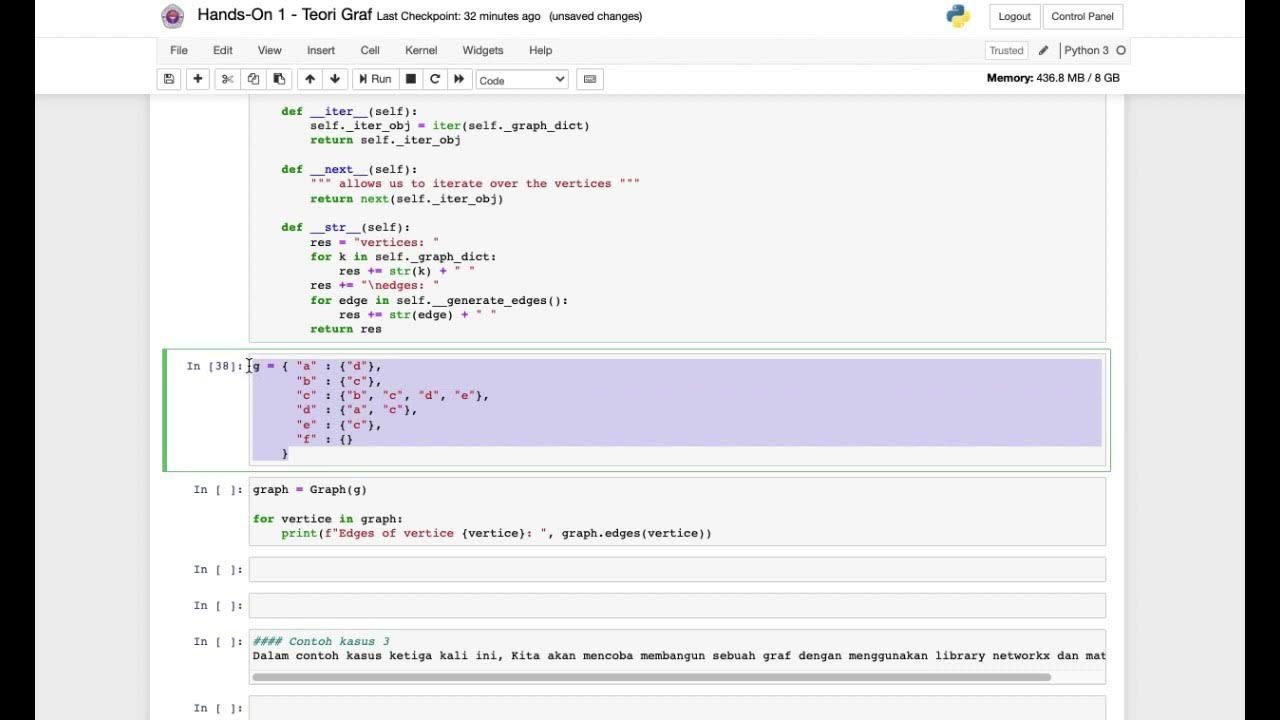
HandsOn Pengenalan Teori Graf
video1107663336

2.4 Linked List Implementation in C/C++ | Creation and Display | DSA Tutorials

Design System 101: free Beginner Figma Tutorial for UIUX Designers

Decision Tree Algorithm | Decision Tree in Machine Learning | Tutorialspoint

Tutorial-12: Customizing Working Preferences and Bus Connections
5.0 / 5 (0 votes)
