Independent-samples t-test in SPSS
Summary
TLDRThis video explains the process of using an independent sample t-test to compare the mean scores between two groups, such as male and female students. It covers essential prerequisite tests, including normality of data distribution and homogeneity of variances, using SPSS. The video walks through the steps of defining variables, testing for normality, and running the t-test, illustrating with an example of comparing reading scores. The final analysis concludes that while there is a mean difference, it is not statistically significant, emphasizing the importance of hypothesis testing in statistical analysis.
Takeaways
- 😀 The independent sample t-test is used to compare the mean scores between two groups of participants.
- 😀 Before conducting the t-test, two prerequisite tests are needed: the normality of data distribution and homogeneity of variances.
- 😀 The normality test is performed using the Shapiro-Wilk test. If p-value > 0.05, the data is normally distributed.
- 😀 The homogeneity of variances test is done using Levene’s test. If p-value > 0.05, variances between groups are equal.
- 😀 Example research questions include comparing reading scores between male and female students or comparing GPA between two groups.
- 😀 In SPSS, data needs to be entered with appropriate variable labels, such as male and female for the group variable.
- 😀 If the normality assumption is violated, a non-parametric test like the Mann-Whitney U test should be used instead of the t-test.
- 😀 The t-test is only valid if both normality and homogeneity assumptions are met.
- 😀 When performing a t-test, a p-value below 0.05 indicates a significant difference between the groups, while a p-value above 0.05 suggests no significant difference.
- 😀 In the example of male vs female reading scores, the p-value of 0.322 indicates no significant difference, leading to the retention of the null hypothesis.
Q & A
What is the independent sample t-test used for?
-The independent sample t-test is used to compare the mean scores between two groups of participants, such as comparing reading scores between two classes or comparing GPA between males and females.
What are the two prerequisite tests before performing a t-test?
-The two prerequisite tests before performing a t-test are the normality of data distribution test and the homogeneity of variances test.
Which tests are used to check normality of data distribution?
-The normality of data distribution is checked using the Shapiro-Wilk test and the Kolmogorov-Smirnov test.
What does a p-value greater than 0.05 mean in a normality test?
-A p-value greater than 0.05 in a normality test means that the data is normally distributed.
How is the homogeneity of variances tested?
-Homogeneity of variances is tested using Levene's test. If the p-value is above 0.05, it indicates that the variances between the two groups are equal.
What should you do if the variances between two groups are not equal in a t-test?
-If the variances between two groups are not equal, you should use the 'equal variances not assumed' option in the t-test.
What does the p-value signify in a t-test result?
-In a t-test result, the p-value indicates the significance of the difference between the two groups. A p-value below 0.05 means the difference is statistically significant, while a p-value above 0.05 means the difference is not significant.
In the given example, what was the result of the t-test for comparing reading scores between male and female students?
-The result of the t-test showed a p-value of 0.322, which is above 0.05. This means that the test failed to reject the null hypothesis, indicating there is no significant mean difference in reading scores between male and female students.
Why is it important to define the groups correctly when performing a t-test in SPSS?
-It is important to define the groups correctly in SPSS because the software needs to know which two groups to compare. For example, if comparing males and females, you need to define the 'M' and 'F' groups in the software to perform the analysis correctly.
What is the interpretation of the mean scores in the descriptive statistics table for male and female students in the example?
-In the descriptive statistics table, the mean score for female students is 56.01, while for male students, it is 51.10. This indicates that, on average, female students performed better than male students on the reading test.
Outlines

Этот раздел доступен только подписчикам платных тарифов. Пожалуйста, перейдите на платный тариф для доступа.
Перейти на платный тарифMindmap

Этот раздел доступен только подписчикам платных тарифов. Пожалуйста, перейдите на платный тариф для доступа.
Перейти на платный тарифKeywords

Этот раздел доступен только подписчикам платных тарифов. Пожалуйста, перейдите на платный тариф для доступа.
Перейти на платный тарифHighlights

Этот раздел доступен только подписчикам платных тарифов. Пожалуйста, перейдите на платный тариф для доступа.
Перейти на платный тарифTranscripts

Этот раздел доступен только подписчикам платных тарифов. Пожалуйста, перейдите на платный тариф для доступа.
Перейти на платный тарифПосмотреть больше похожих видео

STATISTIKA - Uji T Sampel Bebas (Independent Samples T Test) Perhitungan Manual

Cara Uji Beda Dua Kelompok dengan Jamovi | Independent Sample t-test dan Paired Sample t-test

Tutorial Analisis Independent Sample t test dengan JASP

KULIAH STATISTIK - ANALISIS T-TEST

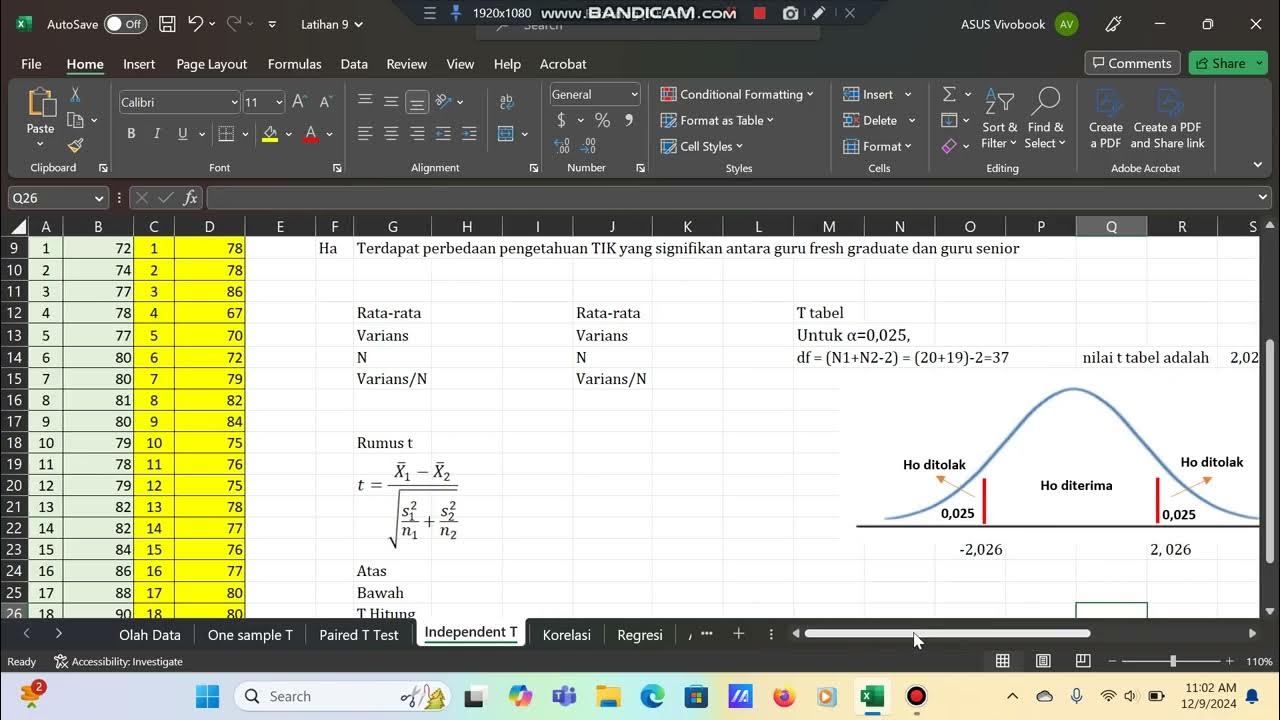
Independent samples t-test secara manual dengan bantuan Ms. Excel

uji beda rata-rata
5.0 / 5 (0 votes)
