Powerful ICT Institutional Swing Points Entry Strategy
Summary
TLDRThis video explains two powerful institutional swing points used for trade entry in the smart money concept. The first, known as the liquidity sweep pattern, occurs when institutions grab liquidity above a recent high or below a recent low, and then push price in the opposite direction. The second, the failure swing, happens when price retraces and fails to reach a previous high or low before reversing. Both patterns, the breaker block and failure swing, serve as key indicators for retail traders to spot institutional footprints and enter trades with high probability.
Takeaways
- 😀 The script explains two powerful institutional swing points used for trade entry based on the ICT concept: the Liquidity Sweep pattern and the Failure Swing pattern.
- 😀 Liquidity Sweep is when institutions target liquidity above a recent high, picking stop losses, before pushing the price down to a lower level. This creates a breaker block entry point for retail traders.
- 😀 The first swing point pattern involves identifying a liquidity sweep above a recent high, then waiting for a retracement to the breaker block, where you can enter the trade.
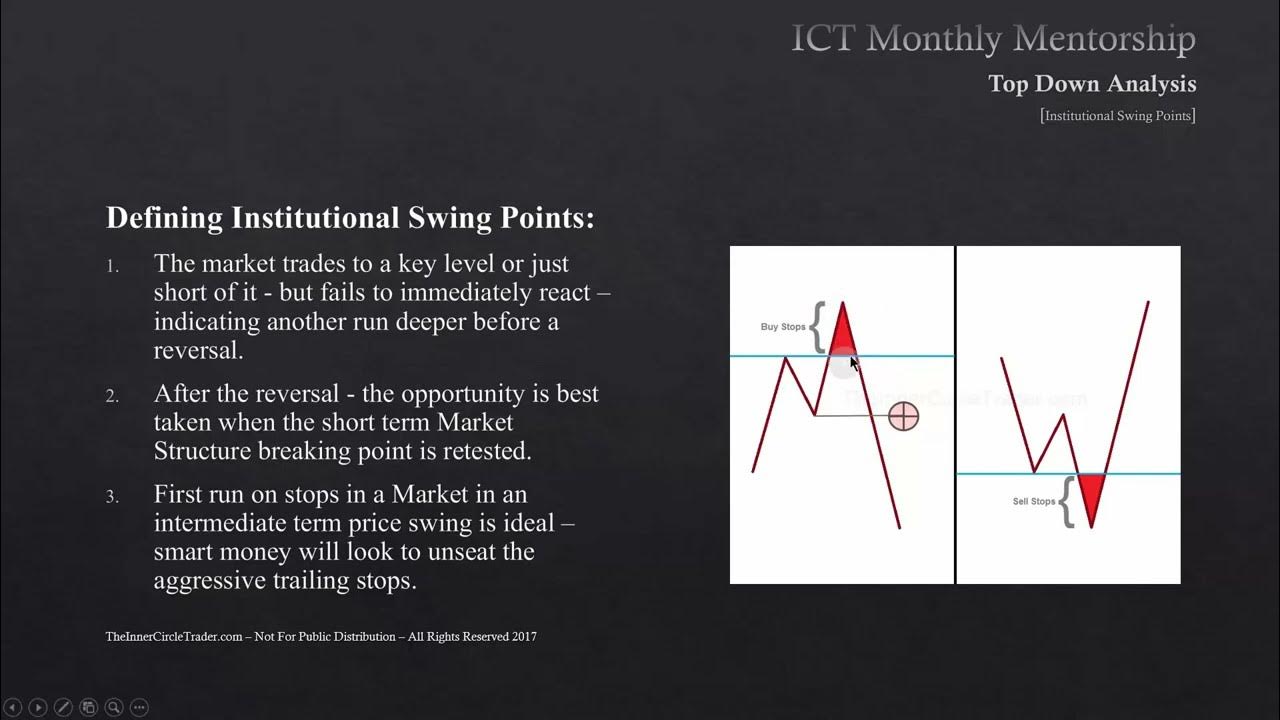
- 😀 Institutions often target liquidity in the form of buy stops above old highs and sell stops below old lows. Liquidity is treated as money in the context of smart money trading.
- 😀 The second pattern discussed is the Failure Swing, where price pushes above a high but fails to reach the low, leading to a price reversal after a retracement.
- 😀 Both patterns can be bullish or bearish, and they provide opportunities for entry when the price retraces back to the breaker or mitigation block.
- 😀 Retail traders should wait for the price to return to these key levels (breaker block or mitigation block) to make a trade entry based on the institutional price action.
- 😀 The key entry point for both patterns is marked by the last bullish or bearish candle before the price reversal occurs. Stop losses should be placed above or below the identified level.
- 😀 The Failure Swing pattern is distinguished by the price failing to reach the high or low before reversing direction, while the Liquidity Sweep pattern involves price reaching the liquidity zone before reversal.
- 😀 The script emphasizes the importance of identifying these institutional swing points and understanding their formation in order to trade the smart money concept effectively.
Q & A
What is the first institutional swing point discussed in the video?
-The first institutional swing point discussed is the liquidity sweep pattern, where institutions sweep liquidity above a recent high or below a recent low before pushing the price in the opposite direction.
How does a liquidity sweep pattern work?
-In a liquidity sweep pattern, institutions target liquidity, which is located above a recent high or below a recent low. The price moves to sweep the liquidity before reversing and retracing to a breaker block for a potential trade entry.
What is a 'breaker block' in the context of institutional swing points?
-A breaker block is the last bullish or bearish candle before a liquidity sweep occurs. It is marked as the entry point for a retail trader after the price retraces back to it following the liquidity sweep.
What role does liquidity play in smart money trading?
-Liquidity represents stop-loss orders that act as 'money' for institutions. By targeting and collecting these stop-loss orders, institutions can manipulate price movement, which creates entry opportunities for retail traders following the smart money concept.
What is the difference between a bullish and bearish liquidity sweep pattern?
-In a bullish liquidity sweep, the price sweeps above a recent high before reversing and retracing to a breaker block. In a bearish liquidity sweep, the price sweeps below a recent low before reversing and retracing to a breaker block.
What is the second institutional swing point discussed?
-The second institutional swing point is the failure swing pattern, where the price fails to reach a recent high or low before reversing direction. This pattern signals that institutions may be setting up for a price move in the opposite direction.
How does the failure swing pattern differ from the breaker pattern?
-The failure swing pattern occurs when price fails to reach a recent high or low before reversing, while the breaker pattern involves price sweeping above or below a recent high or low to collect liquidity before reversing to a breaker block.
How can a retail trader identify a failure swing pattern?
-A retail trader can identify a failure swing pattern when the price fails to reach a recent high or low and then reverses direction. The trader would then wait for the price to return to the last bullish or bearish candle to enter a trade.
What is meant by 'institutional footprints' in the video?
-Institutional footprints refer to the price patterns left by institutions as they manipulate the market by collecting liquidity from stop-loss orders. Retail traders can identify these footprints to determine the best entry points for trades.
Why is the breaker pattern considered the most powerful of the institutional swing points?
-The breaker pattern is considered the most powerful because it involves the price sweeping liquidity, which has already been accumulated above a recent high or below a recent low, before reversing. This provides a strong indication that institutions have made their move and that a potential trade entry is near.
Outlines

Этот раздел доступен только подписчикам платных тарифов. Пожалуйста, перейдите на платный тариф для доступа.
Перейти на платный тарифMindmap

Этот раздел доступен только подписчикам платных тарифов. Пожалуйста, перейдите на платный тариф для доступа.
Перейти на платный тарифKeywords

Этот раздел доступен только подписчикам платных тарифов. Пожалуйста, перейдите на платный тариф для доступа.
Перейти на платный тарифHighlights

Этот раздел доступен только подписчикам платных тарифов. Пожалуйста, перейдите на платный тариф для доступа.
Перейти на платный тарифTranscripts

Этот раздел доступен только подписчикам платных тарифов. Пожалуйста, перейдите на платный тариф для доступа.
Перейти на платный тарифПосмотреть больше похожих видео

The Truth About Inducement In ICT Concepts

The Market Is Rigged: Here’s How You Can Still Win

Overview of the FREE Price Action Smart Money Concepts toolkit | BigBeluga

ICT Market Maker Model - Explained In-depth!
ICT Mentorship Core Content - Month 05 - Defining Institutional Swing Points

ICT Institutional Order Flow Explained – Trade Like the Banks and Outsmart the Market
5.0 / 5 (0 votes)
