Wk 4 part3
Summary
TLDRThis video explains how to compare two sample groups using statistical tests, specifically focusing on the t-test. The presenter discusses the importance of determining whether the variances of two groups are equal, and how to decide which t-test formula to use based on this. Using a real-world example related to coal energy density in China and Australia, the video walks through the process of performing the necessary tests in R, interpreting the results, and understanding their implications in the context of global coal production and emissions. The video concludes with a discussion on the practical significance of the findings.
Takeaways
- 😀 The script focuses on comparing two samples using t-tests, highlighting the decision-making process when choosing the appropriate formula based on variance equality.
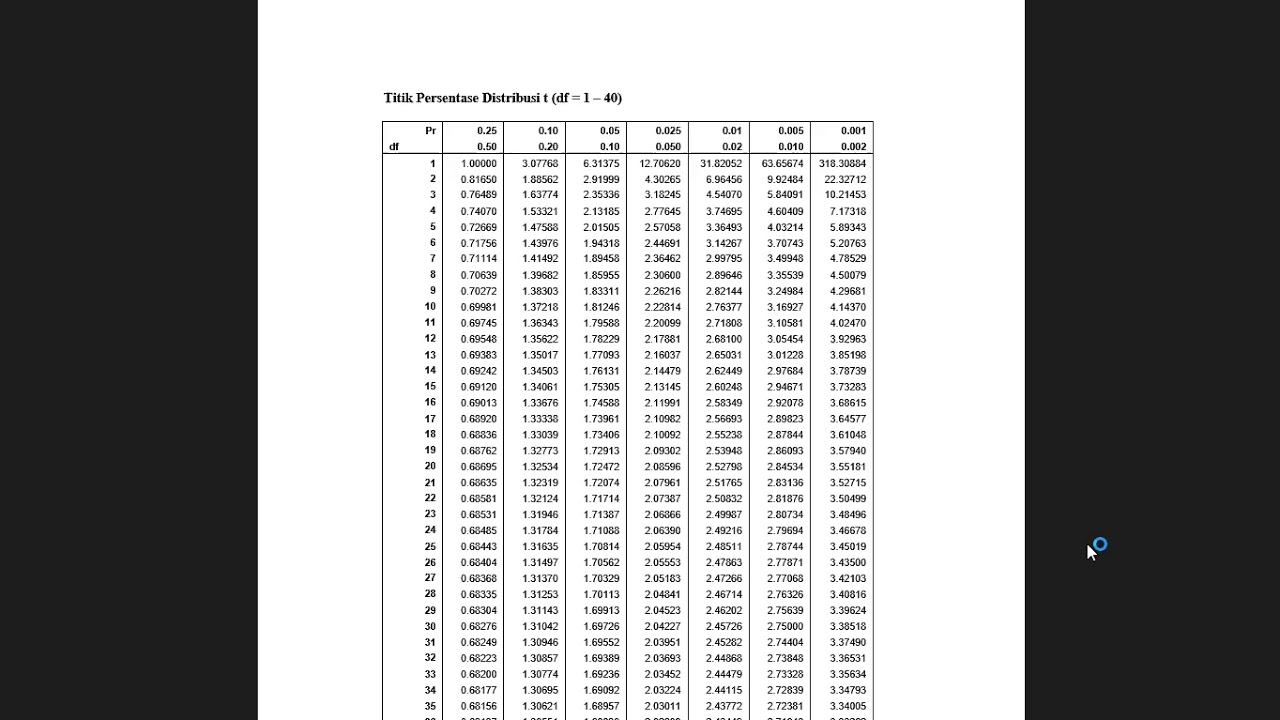
- 😀 Before conducting a t-test, a variance ratio test is used to determine whether the variances of the two groups are equal or different.
- 😀 A variance ratio test is conducted by dividing the variances of the two groups and analyzing the ratio, where a value close to 1 indicates equal variances.
- 😀 The context of the test is based on comparing coal energy density in Australia and China to determine whether Australian coal's energy density is significantly higher.
- 😀 The t-test decision-making process depends on whether the variances between the two groups are equal or unequal, which guides the formula choice.
- 😀 Visualizing the data with box plots helps to see the spread and possible differences, but formal tests are used to remove subjectivity in analysis.
- 😀 The t-test results in a p-value which helps decide whether to reject or not reject the null hypothesis (i.e., if the two means are the same).
- 😀 A low p-value (less than 0.05) indicates a statistically significant difference between the two groups' means, leading to the rejection of the null hypothesis.
- 😀 The script uses data from two groups (Australia and China) to test a hypothesis about coal energy density and its environmental impact.
- 😀 While the t-test shows statistical significance, further steps are required to assess whether the difference is practically important, especially in environmental and social contexts.
Q & A
What is the primary objective of comparing two samples in the context of this script?
-The primary objective is to determine whether the means of two groups (in this case, coal energy content from China and Australia) are significantly different from each other.
Why is it important to test for equal variances when performing a t-test between two groups?
-It is important because there are two different t-test formulas: one for equal variances and one for unequal variances. The choice of formula affects the validity of the test results.
What is a variance ratio test, and how is it used in the decision-making process?
-A variance ratio test is used to decide which t-test formula to use. It tests whether the variances of the two groups are equal by calculating the ratio of the variances. If the ratio is close to 1, the variances are considered equal, and the standard t-test is used.
What is the significance of the energy content of coal in the context of this analysis?
-The energy content of coal is significant because the proposition is that Australian coal, with higher energy density, might displace lower-quality coal from other regions, potentially leading to a reduction in global CO2 emissions.
How does the data analysis process begin in this script?
-The data analysis process begins by reading in the data into R, checking the structure of the data, and using summary statistics to get an overview of the sample values, including the means of both the China and Australia coal samples.
What statistical method is applied to compare the two coal samples from China and Australia?
-A two-sample t-test is applied to compare the means of the two coal samples, determining whether the difference in means is statistically significant.
What role does the box plot play in understanding the data?
-The box plot visually represents the distribution of the data, allowing the comparison of the two samples and highlighting any potential differences in energy content between the China and Australia coal samples.
Why is the hypothesis for the t-test written as 'mean of group 1 equals mean of group 2'?
-This is a standard null hypothesis for the t-test, which assumes that the means of both groups are equal. The purpose is to test if there is enough evidence to reject this null hypothesis in favor of the alternative that the means are different.
How is the t-test conducted in R, and what does the output indicate?
-In R, the t-test is conducted using the `t.test` function, specifying the variables and the unequal variance assumption. The output provides the p-value, which helps determine if the null hypothesis should be rejected. A p-value less than 0.05 suggests a statistically significant difference between the two groups.
What is the importance of determining practical significance after finding statistical significance?
-Determining practical significance is crucial because statistical significance alone does not necessarily imply that the difference is meaningful in a real-world context. In this case, it helps assess whether the difference in energy content between the two coal samples has any substantial environmental or economic impact.
Outlines

Этот раздел доступен только подписчикам платных тарифов. Пожалуйста, перейдите на платный тариф для доступа.
Перейти на платный тарифMindmap

Этот раздел доступен только подписчикам платных тарифов. Пожалуйста, перейдите на платный тариф для доступа.
Перейти на платный тарифKeywords

Этот раздел доступен только подписчикам платных тарифов. Пожалуйста, перейдите на платный тариф для доступа.
Перейти на платный тарифHighlights

Этот раздел доступен только подписчикам платных тарифов. Пожалуйста, перейдите на платный тариф для доступа.
Перейти на платный тарифTranscripts

Этот раздел доступен только подписчикам платных тарифов. Пожалуйста, перейдите на платный тариф для доступа.
Перейти на платный тариф


5.0 / 5 (0 votes)
