STATPRO - 10 Point and Interval Estimate of population Mean
Summary
TLDRThis video tutorial explains how to estimate a population mean using confidence intervals. The process involves using a sample's mean, standard deviation, and a chosen confidence level (99% in this case). The video walks through the steps: calculating degrees of freedom, finding the critical t-value, determining the margin of error, and using these values to form a confidence interval. By the end of the video, viewers understand how to compute an interval estimate and interpret it to gauge the true population mean with a specified level of confidence.
Takeaways
- 😀 Takeaway 1: The script explains how to calculate the point and interval estimate for a population mean using sample data.
- 😀 Takeaway 2: The sample size (n) is 25, the sample mean (×x) is 18, and the sample standard deviation (s) is 1.3.
- 😀 Takeaway 3: The confidence level for the interval estimate is 99%.
- 😀 Takeaway 4: Degrees of freedom (df) are calculated as n - 1, which in this case is 24.
- 😀 Takeaway 5: The critical value (t-value) is found using the t-distribution table, which for 24 degrees of freedom and 99% confidence is 2.797.
- 😀 Takeaway 6: The formula for the margin of error (E) is: E = t × (s / √ n).
- 😀 Takeaway 7: The margin of error is calculated to be 0.73 by substituting the known values into the formula.
- 😀 Takeaway 8: The confidence interval is found by subtracting and adding the margin of error to the sample mean.
- 😀 Takeaway 9: The resulting confidence interval for the population mean is between 17.27 and 18.73.
- 😀 Takeaway 10: The 99% confidence interval indicates that the true population mean is likely to fall within this range, with 99% confidence.
Q & A
What is the sample size in this case?
-The sample size is 25, as the analysis is based on a sample of 25 trainees.
What is the sample mean age of the trainees?
-The sample mean age of the trainees is 18 years.
What is the sample standard deviation for the age of the trainees?
-The sample standard deviation is 1.3 years.
What is the confidence level used in this example?
-The confidence level used is 99%.
How is the degrees of freedom calculated?
-The degrees of freedom (df) is calculated by subtracting 1 from the sample size, so df = 25 - 1 = 24.
Where do you find the critical value (t-value) for the 99% confidence level?
-You find the critical value by referring to a t-distribution table with 24 degrees of freedom and a 99% confidence level. The critical value in this case is 2.797.
How is the margin of error calculated?
-The margin of error is calculated using the formula: E = t × (s / √n), where t is the critical value, s is the sample standard deviation, and n is the sample size. In this case, E = 2.797 × (1.3 / √25) = 0.73.
What is the formula used to compute the confidence interval?
-The formula for the confidence interval is: (sample mean - margin of error, sample mean + margin of error). In this case, it is (18 - 0.73, 18 + 0.73), resulting in a confidence interval of (17.27, 18.73).
What does the confidence interval represent in this example?
-The confidence interval represents the range within which we estimate the population mean age of the trainees lies, with 99% confidence. In this case, we estimate the population mean to be between 17.27 and 18.73 years.
Why do we use the t-distribution instead of the z-distribution in this example?
-The t-distribution is used because the sample size is small (n = 25), and we are using the sample standard deviation rather than the population standard deviation. The t-distribution is more appropriate for small sample sizes and when the population standard deviation is unknown.
Outlines

Этот раздел доступен только подписчикам платных тарифов. Пожалуйста, перейдите на платный тариф для доступа.
Перейти на платный тарифMindmap

Этот раздел доступен только подписчикам платных тарифов. Пожалуйста, перейдите на платный тариф для доступа.
Перейти на платный тарифKeywords

Этот раздел доступен только подписчикам платных тарифов. Пожалуйста, перейдите на платный тариф для доступа.
Перейти на платный тарифHighlights

Этот раздел доступен только подписчикам платных тарифов. Пожалуйста, перейдите на платный тариф для доступа.
Перейти на платный тарифTranscripts

Этот раздел доступен только подписчикам платных тарифов. Пожалуйста, перейдите на платный тариф для доступа.
Перейти на платный тарифПосмотреть больше похожих видео
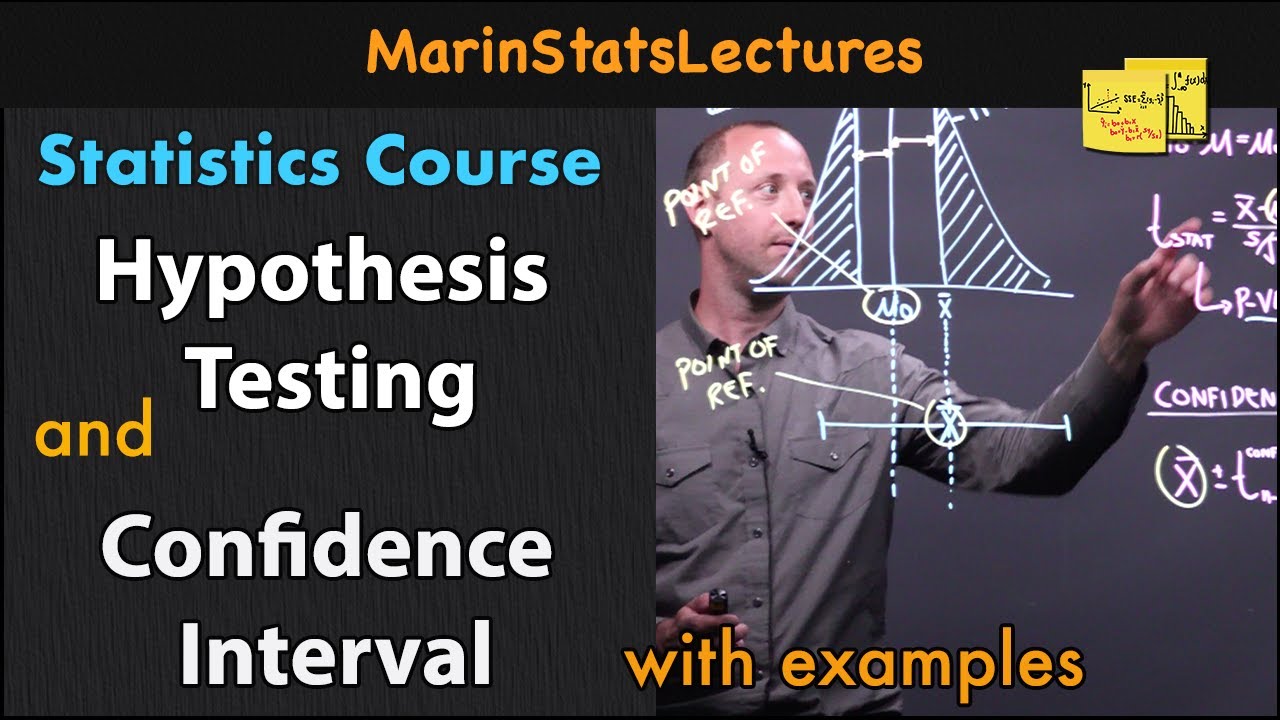
Hypothesis Test vs. Confidence Interval | Statistics Tutorial #15 | MarinStatsLectures
Understanding Confidence Intervals: Statistics Help
Confidence Interval [Simply explained]

Student's T Distribution - Confidence Intervals & Margin of Error
Normal Approximation to Sample Mean
Confidence Intervals, Clearly Explained!!!
5.0 / 5 (0 votes)
