Distribuição de frequência com classes
Summary
TLDRIn this tutorial, the presenter teaches how to construct a frequency distribution table using mass data, covering sorting, calculating class intervals, and computing absolute and relative frequencies. The process begins with organizing the data in ascending order, followed by calculating the class intervals using a specific formula. The script explains how to determine the frequency of values within each interval and provides a step-by-step guide to filling out the table. The tutorial also covers cumulative frequency, relative frequency, and cumulative relative frequency, ensuring a comprehensive understanding of data analysis and presentation.
Takeaways
- 😀 The script explains how to construct a frequency distribution table with class intervals in statistics.
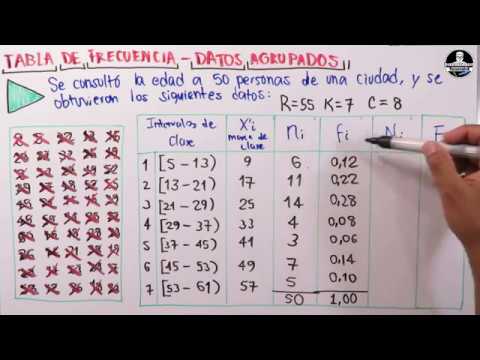
- 😀 The first step is to sort the given data in ascending order to organize the values.
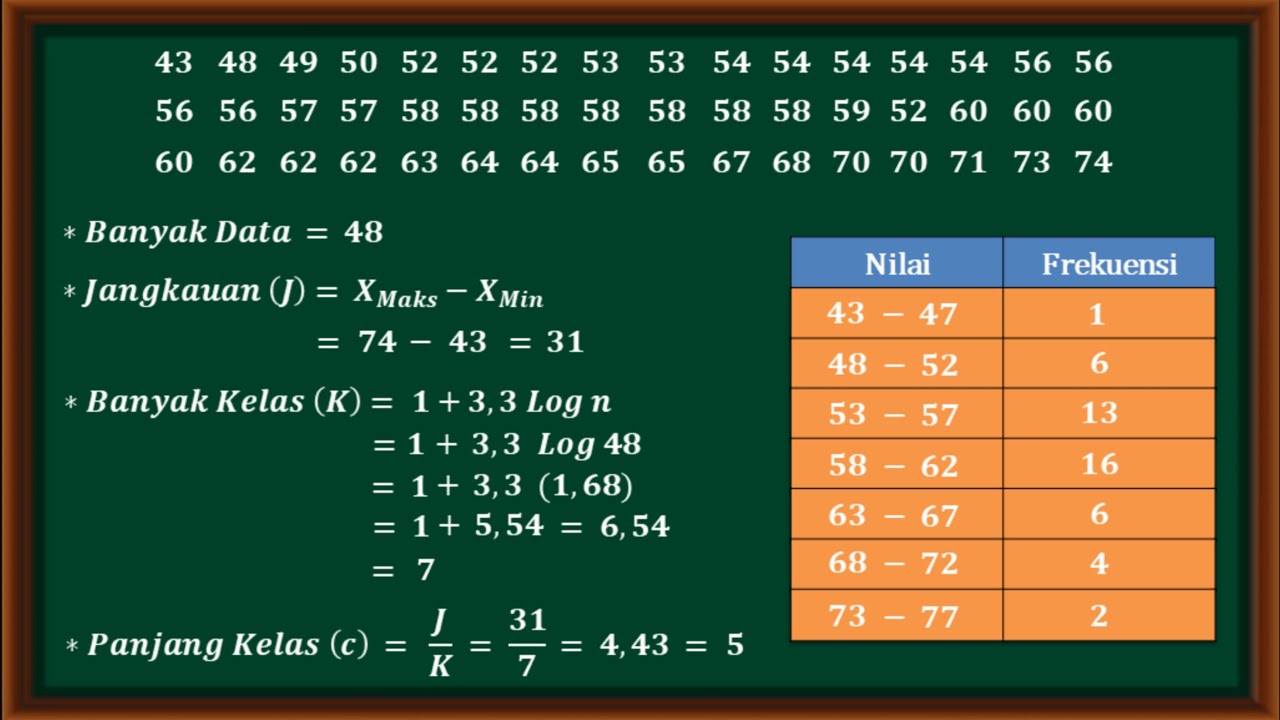
- 😀 The script highlights the importance of calculating the range (the difference between the maximum and minimum values).
- 😀 The next step involves calculating the class interval width, which can be done by dividing the total range by the number of intervals.
- 😀 It is recommended to round the class interval width to a whole number for clarity and ease of calculation.
- 😀 The process of creating class intervals involves adding the class interval width to the lowest value to form each class.
- 😀 After determining the class intervals, the frequency (the number of values within each interval) must be calculated.
- 😀 The absolute frequency represents how many data points fall within each class interval, excluding the upper limit of the interval.
- 😀 The cumulative frequency adds up the frequencies from all previous intervals, showing the cumulative total.
- 😀 The relative frequency is calculated by dividing the absolute frequency by the total number of data points, and it is often expressed as a percentage.
- 😀 The cumulative relative frequency accumulates the relative frequencies from all intervals, and it should always sum to 100%.
Q & A
What is the first step in constructing a frequency distribution table with class intervals?
-The first step is to organize the data in ascending order to ensure it is sorted correctly before further analysis.
How do you calculate the range of a dataset?
-The range is calculated by subtracting the smallest value from the largest value in the dataset.
Why is the class interval width important in creating a frequency distribution table?
-The class interval width determines the size of each interval in the distribution, helping to categorize data efficiently. It is calculated by dividing the range by the number of desired intervals.
What formula is used to calculate the class width when it's not provided?
-If the class width is not provided, it can be calculated using the formula: Class width = (Range of data) / (Number of classes).
How do you determine the absolute frequency for each class interval?
-To determine the absolute frequency, count how many data points fall within each class interval.
What is cumulative frequency and how is it calculated?
-Cumulative frequency is the sum of frequencies up to a certain class interval. It is calculated by progressively adding each class's absolute frequency to the previous total.
How is relative frequency calculated?
-Relative frequency is calculated by dividing the absolute frequency of a class interval by the total number of observations, then multiplying by 100 to convert it into a percentage.
What is cumulative relative frequency?
-Cumulative relative frequency is the percentage of data points that fall within or below each class interval. It is calculated by adding the relative frequencies progressively.
What happens if the class width calculation results in a decimal value?
-If the class width results in a decimal, it is typically rounded to the nearest whole number to avoid using non-integer class widths, which are difficult to interpret.
How do you check if the total of the frequencies and cumulative frequencies is correct?
-To verify the correctness, check that the sum of the absolute frequencies equals the total number of data points. The cumulative frequency should also match the total number of data points at the final interval.
Outlines

Этот раздел доступен только подписчикам платных тарифов. Пожалуйста, перейдите на платный тариф для доступа.
Перейти на платный тарифMindmap

Этот раздел доступен только подписчикам платных тарифов. Пожалуйста, перейдите на платный тариф для доступа.
Перейти на платный тарифKeywords

Этот раздел доступен только подписчикам платных тарифов. Пожалуйста, перейдите на платный тариф для доступа.
Перейти на платный тарифHighlights

Этот раздел доступен только подписчикам платных тарифов. Пожалуйста, перейдите на платный тариф для доступа.
Перейти на платный тарифTranscripts

Этот раздел доступен только подписчикам платных тарифов. Пожалуйста, перейдите на платный тариф для доступа.
Перейти на платный тарифПосмотреть больше похожих видео

DISTRIBUIÇÃO DE FREQUÊNCIA ✅ ESTATÍSTICA

STATISTIK. Cara membuat tabel distribusi frekuensi (tabel data kelompok)
Cara mudah menyusun tabel distribusi kelompok
Aprende a construir una Tabla de frecuencia con datos agrupados

FREQUENCY DISTRIBUTION: How to do it? Vid#5 FREE Tutorial Statistical Analysis | EASILY EXPLAINED!

STATISTIKA : nilai jangkauan banyak kelas panjang kelas dan menyusun tabel distribusi frekuensi
5.0 / 5 (0 votes)
