Chapter 5 - Tutorial Analisa Data Part 2 (COUNTIFS) | Informatika Booster
Summary
TLDRThis video tutorial demonstrates how to calculate and analyze gender-based data across different classes using Excel's COUNTIFS function. The tutorial explains how to count male and female students in each class (1, 2, and 3), by combining two parameters: gender and class. It walks through the process of entering formulas, reviewing results, and visualizing the data with a bar chart. The video also covers the use of Pivot Tables to manage and summarize the data, helping users efficiently analyze gender distribution across multiple classes without manual calculations.
Takeaways
- 😀 Using `COUNTIFS` allows you to count entries based on multiple criteria, such as gender and class.
- 😀 To count the number of male students in class 1, the formula is `COUNTIFS(gender_range, 'Male', class_range, '1')`.
- 😀 The `COUNTIFS` function can handle more than one condition, which is useful for counting based on both gender and class.
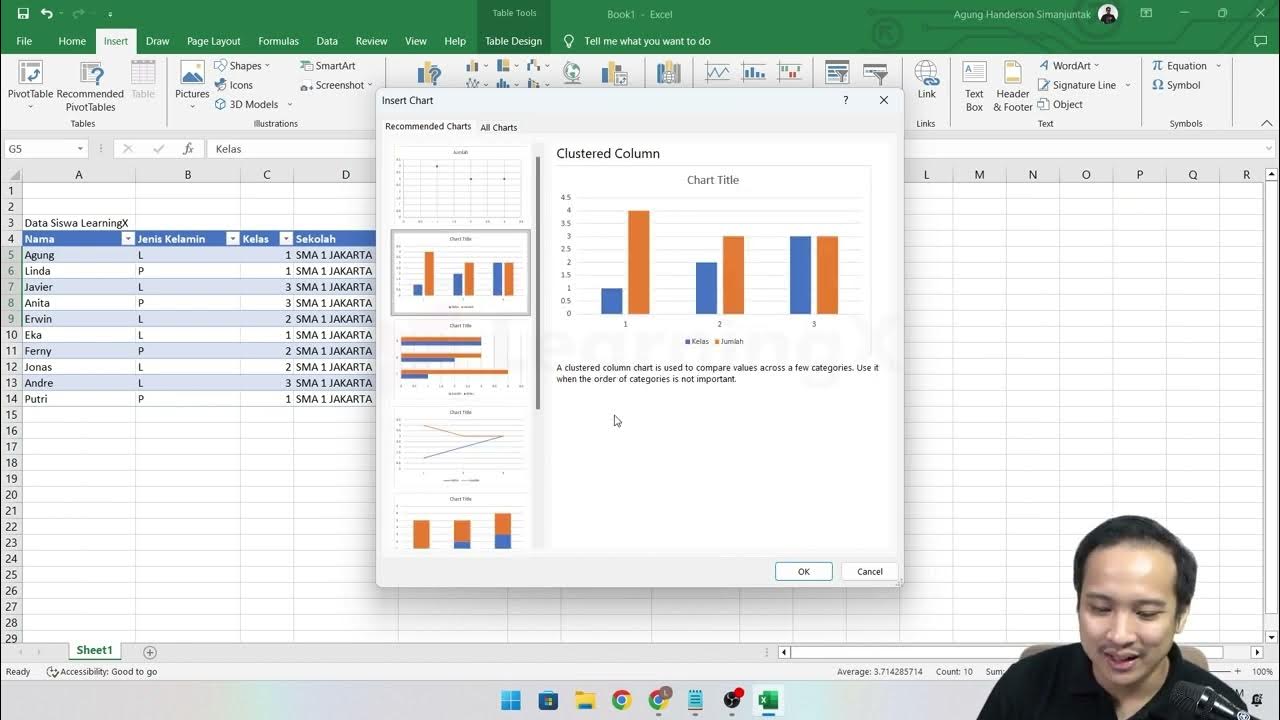
- 😀 You can create clear data visualizations in Excel using bar charts to represent gender distribution across classes.
- 😀 Adjusting the axis in charts allows for better readability and appropriate scaling of the data.
- 😀 When working with `COUNTIFS`, ensure that each condition is clearly specified to get accurate results for each parameter.
- 😀 Pivot tables can help manage and summarize data efficiently, making it easier to analyze gender and class distributions in one view.
- 😀 Using charts and pivot tables together provides both visual and tabular summaries of the data, enhancing understanding.
- 😀 You can filter data to remove unnecessary series or labels in your charts for cleaner presentations.
- 😀 Manually calculating totals for each category (like gender) can be cross-checked with automated functions in Excel to ensure accuracy.
Q & A
What is the main task being explained in the script?
-The script explains how to use Excel's `COUNTIFS` function to count the number of male and female students in different classes (Class 1, 2, and 3), based on two parameters: gender and class.
What function is used to calculate the count of students based on multiple criteria?
-The `COUNTIFS` function is used, which allows for counting based on multiple conditions or criteria, such as gender and class.
How does the `COUNTIFS` function work in the context of the script?
-The `COUNTIFS` function is used to count the number of students that match both the gender and class criteria. For example, it counts how many males are in Class 1, Class 2, or Class 3 by specifying both criteria in the function.
What parameters are being used for the counting process?
-The two parameters being used are gender (male or female) and class (Class 1, Class 2, or Class 3).
What is the outcome of using the `COUNTIFS` function for male students in Class 1?
-The result shows that there are 2 male students in Class 1, namely Agung and Eka.
How does the script handle counting for female students?
-The same process is applied for female students. The `COUNTIFS` function is used to count how many females are in each class. For example, in Class 1, there are 2 female students: Linda and Putri.
What type of chart is created at the end of the process?
-A clustered bar chart is created to visually represent the number of male and female students in each class.
How is the chart customized after it is created?
-The chart is customized by editing the axis options to display a maximum value of 3, which corresponds to the number of classes. The series labels are also adjusted to focus on the gender and class distribution.
What alternative tool is introduced for easier data management?
-The script introduces the use of Pivot Tables as an alternative tool to manage and summarize the data. Pivot Tables allow the user to easily create tables showing the number of students per class and gender.
What does the script suggest as a manual verification step for the total number of students?
-The script suggests manually verifying the total number of students by adding up the individual counts for males and females in each class, which should result in a total of 10 students.
Outlines

Этот раздел доступен только подписчикам платных тарифов. Пожалуйста, перейдите на платный тариф для доступа.
Перейти на платный тарифMindmap

Этот раздел доступен только подписчикам платных тарифов. Пожалуйста, перейдите на платный тариф для доступа.
Перейти на платный тарифKeywords

Этот раздел доступен только подписчикам платных тарифов. Пожалуйста, перейдите на платный тариф для доступа.
Перейти на платный тарифHighlights

Этот раздел доступен только подписчикам платных тарифов. Пожалуйста, перейдите на платный тариф для доступа.
Перейти на платный тарифTranscripts

Этот раздел доступен только подписчикам платных тарифов. Пожалуйста, перейдите на платный тариф для доступа.
Перейти на платный тарифПосмотреть больше похожих видео

Peringkasan Data Menggunakan Fungsi SUMIFS & COUNTIFS | Materi Informatika Kelas 8 Bab Analisis Data
Chapter 5 - Tutorial Analisa Data Part 1 (COUNT IF)
LANGSUNG BISA Rumus Count, Countif, dan, Countifs | Tutorial Excel Pemula - ignasiusryan
Using the Excel FILTER Function to Create Dynamic Filters

Capítulo 3 - Funções de usuário: Exemplo de criação e ativação

These are the ONLY 15 functions you need to know in Excel (to get most things done)
5.0 / 5 (0 votes)
