Statistik Terapan: Regresi Logistik penjelasan singkat
Summary
TLDRThis tutorial provides an in-depth explanation of logistic regression, particularly focusing on its application to binary dependent variables (e.g., 1/0 or WTP/Non-WTP). The video explains the process of conducting logistic regression in statistical software, using examples like audit opinions and entrepreneurial interest. Viewers are guided through setting up the data, selecting variables, and interpreting the output. Logistic regression is highlighted as a powerful tool for analyzing categorical outcomes with two possible values, making it ideal for research in areas such as audit opinions or interest levels.
Takeaways
- 😀 Logistic regression is a non-parametric statistical method used when the dependent variable (Y) is binary (0 or 1).
- 😀 Logistic regression is often used for analyzing outcomes like audit opinions, where the variable can only be either 'WTP' (1) or 'Non-WTP' (0).
- 😀 The script provides a practical example using 'Audit Opinion' as a binary dependent variable (1 for WTP, 0 for Non-WTP).
- 😀 Logistic regression is also applicable for other binary outcomes, such as 'Interest in Entrepreneurship', with values coded as 1 for 'Interested' and 0 for 'Not Interested'.
- 😀 To perform logistic regression in SPSS or similar software, the dependent variable (Y) and independent variables (X) need to be defined clearly.
- 😀 The logistic regression model can be set up by selecting *Analyze* > *Regression* > *Binary Logistic* in the software interface.
- 😀 After defining the dependent and independent variables, you can select the 'Save' option to store the results and configure additional options.
- 😀 Logistic regression assumes that the dependent variable follows a binary distribution, such as success/failure, yes/no, or 1/0 outcomes.
- 😀 A key feature of logistic regression is its ability to model probabilities and classify binary outcomes based on independent variables.
- 😀 The process of performing logistic regression includes configuring options for the model, ensuring that all settings match the required specifications before running the analysis.
- 😀 Once the logistic regression model is run, the output will include statistical results that can be interpreted to understand the relationship between the variables.
Q & A
What is logistic regression used for?
-Logistic regression is used to analyze situations where the dependent variable is binary, meaning it has two possible outcomes, such as 0 or 1.
What is an example of a binary dependent variable used in the tutorial?
-An example provided in the tutorial is 'audit opinion,' where the dependent variable is coded as 1 for 'WTP' (Wajar Tanpa Pengecualian) and 0 for any other opinion.
How are binary variables represented in logistic regression?
-Binary variables in logistic regression are represented by two values, typically 1 and 0. For example, 'WTP' is represented as 1, and any other audit opinion is represented as 0.
What is the process to conduct logistic regression in statistical software?
-To conduct logistic regression, go to 'Analyze,' select 'Regression,' then choose 'Binary Logistic.' From there, input the dependent and independent variables, adjust the settings under 'Save' and 'Options,' and run the analysis.
What is the difference between logistic regression and other regression methods?
-Logistic regression differs from other regression methods because it is specifically used for binary outcomes, whereas other regressions (like linear regression) are used for continuous dependent variables.
What does the variable 'Y' represent in the logistic regression example?
-In the example, 'Y' represents the dependent variable, which can be either 'audit opinion' or 'entrepreneurial interest.' It is binary, with values such as 1 for 'WTP' or 0 for 'non-WTP' in the audit opinion example.
Can logistic regression be used with continuous dependent variables?
-No, logistic regression is specifically designed for binary dependent variables. For continuous dependent variables, other regression methods like linear regression are more appropriate.
How is the input for independent variables handled in the software for logistic regression?
-The independent variables (X1, X2, etc.) are placed in the appropriate section under the logistic regression options, with the dependent variable (Y) placed in the dependent variable section.
What are some typical outputs of a logistic regression analysis?
-The output of a logistic regression includes a table with statistical results, such as the regression coefficients, significance levels, and model fit statistics that help interpret the relationship between the independent and dependent variables.
What kind of research scenarios are suitable for logistic regression analysis?
-Logistic regression is suitable for research scenarios where the outcome variable is binary, such as determining if a person is likely to have a specific opinion (WTP vs non-WTP) or if someone is interested in starting a business (interested vs not interested).
Outlines

Этот раздел доступен только подписчикам платных тарифов. Пожалуйста, перейдите на платный тариф для доступа.
Перейти на платный тарифMindmap

Этот раздел доступен только подписчикам платных тарифов. Пожалуйста, перейдите на платный тариф для доступа.
Перейти на платный тарифKeywords

Этот раздел доступен только подписчикам платных тарифов. Пожалуйста, перейдите на платный тариф для доступа.
Перейти на платный тарифHighlights

Этот раздел доступен только подписчикам платных тарифов. Пожалуйста, перейдите на платный тариф для доступа.
Перейти на платный тарифTranscripts

Этот раздел доступен только подписчикам платных тарифов. Пожалуйста, перейдите на платный тариф для доступа.
Перейти на платный тарифПосмотреть больше похожих видео

Lec-5: Logistic Regression with Simplest & Easiest Example | Machine Learning

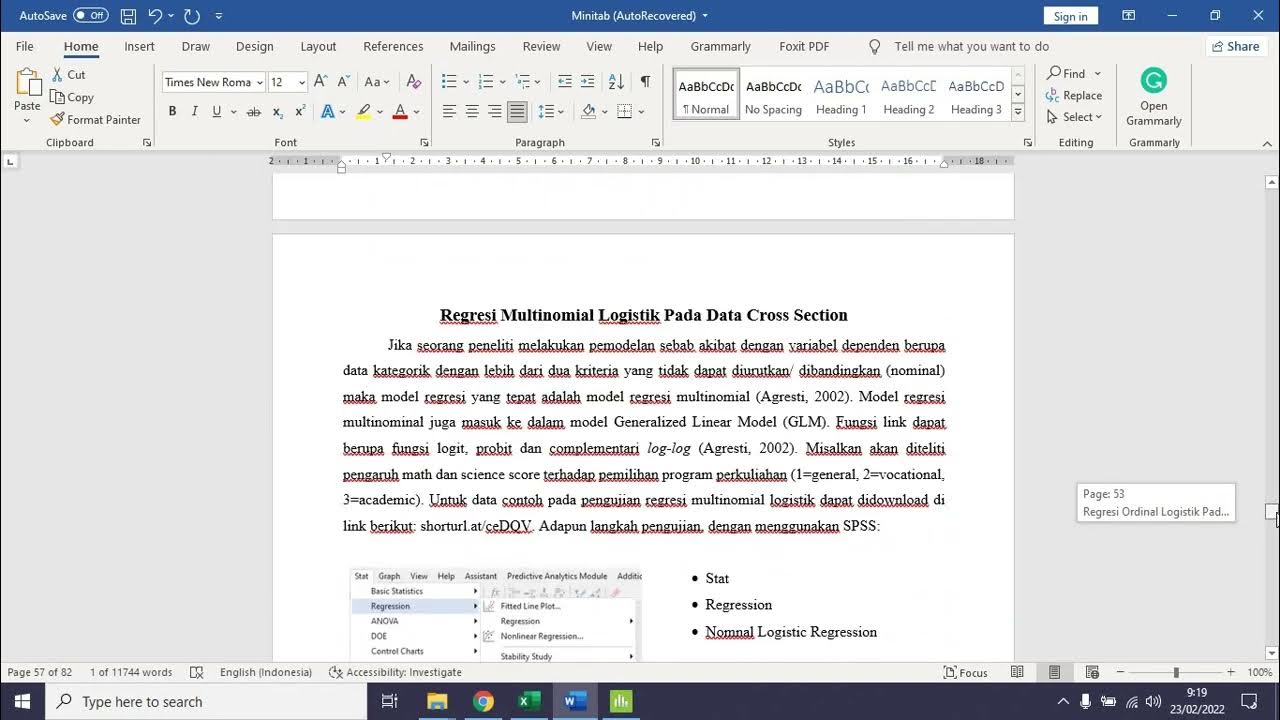
Regresi Ordinal dan Multinomial Logistik Pada Data Crosssection dengan Minitab

Logit model explained: regression with binary variables (Excel)

Konsep Dasar Regresi Logistik

Modul 12 (StatSos2) - Konsep Dasar Regresi Linear Sederhana

35. Regressione Lineare Semplice (Spiegata passo dopo passo)
5.0 / 5 (0 votes)
