The EASIEST ICT Daily Bias Strategy You'll Ever Find
Summary
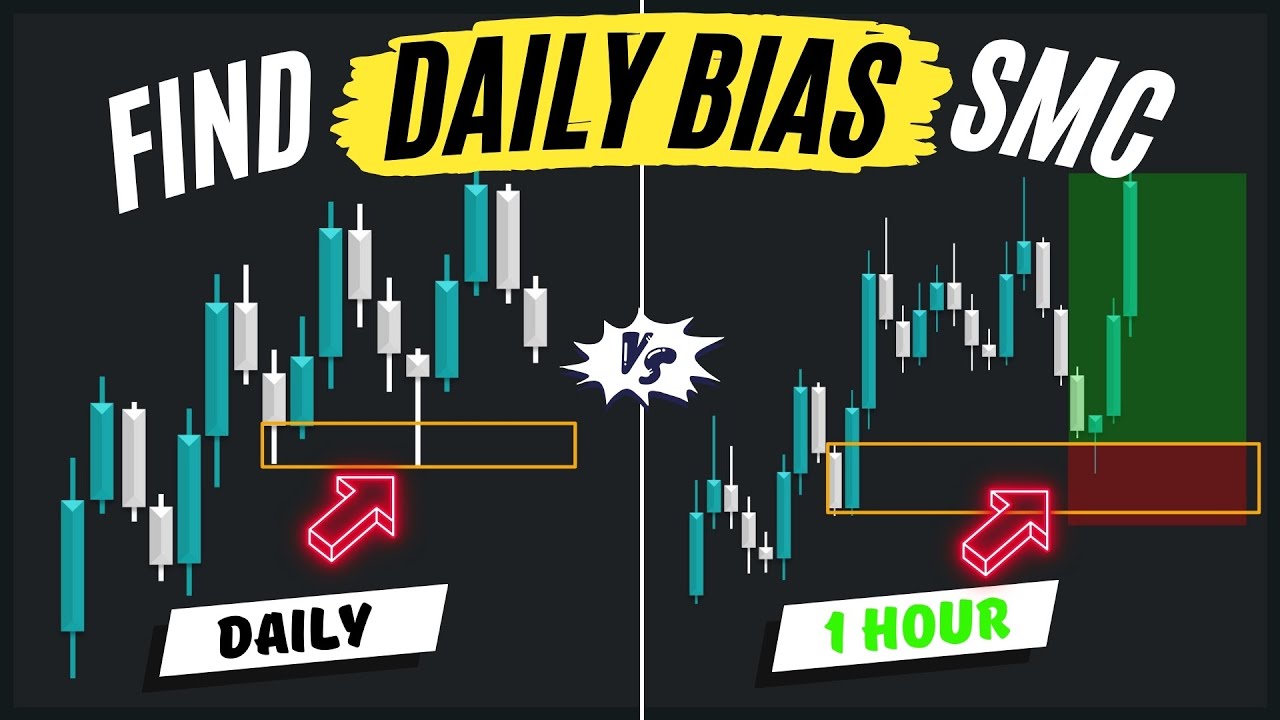
TLDRThis video simplifies how to determine daily market bias for more consistent trading. The strategy combines internal range liquidity (fair value gaps) and external range liquidity (swing highs/lows), using time-based liquidity and market structure for confirmation. By focusing on higher time frames first and then analyzing how lower time frames react, traders can better anticipate price direction. The video stresses the importance of watching liquidity shifts and structural changes, helping traders make high-probability decisions and avoid being stopped out, leading to a clearer approach to market bias and more effective trades.
Takeaways
- 😀 The market is always either seeking external range liquidity (highs or lows) or trading into internal range liquidity (fair value gaps).
- 😀 Daily bias is essential for traders to avoid getting stopped out and to make more consistent trades.
- 😀 Internal range liquidity refers to fair value gaps, while external range liquidity includes any significant high or low in the market.
- 😀 To identify daily bias, start with the higher timeframes and work your way down, examining the most recent market movements.
- 😀 Time-based liquidity (such as previous day or week highs/lows) helps confirm whether the market will continue or reverse at key levels.
- 😀 When the market trades into a fair value gap or external range liquidity, it’s crucial to look for confirmation before shifting your bias.
- 😀 Market reversals are often confirmed when the market fails to displace beyond key time-based liquidity levels, like previous day highs or lows.
- 😀 Lower time frame structure, like shifts in market trends, can provide additional confluence to support the bias developed from higher timeframes.
- 😀 Bullish trades should focus on buying below lows, particularly when the market is failing to displace past those lows with force.
- 😀 Reversals typically occur between Tuesday and Thursday, making this period crucial for tracking changes in market direction.
- 😀 The market’s behavior around opening prices and candle wicks can offer valuable insights into potential bullish or bearish movements.
Q & A
What is the main purpose of this video?
-The video aims to simplify the process of finding daily bias in trading, providing a strategy to improve consistency in trades by focusing on internal and external range liquidity, and using time-based liquidity and market structure.
What are the two main concepts introduced for determining daily bias?
-The two main concepts are internal range liquidity (fair value gaps) and external range liquidity (swing points like highs and lows).
What is internal range liquidity?
-Internal range liquidity refers to fair value gaps, which are areas where price has left a gap that is expected to be rebalanced by the market.
What is external range liquidity?
-External range liquidity refers to swing points, specifically any highs or lows in the market, which are potential targets for price to seek or rebalance towards.
How does the market typically behave, according to the video?
-The market is always either seeking a high or a low, or rebalancing a fair value gap. This behavior drives price movements and determines bias.
What role does time-based liquidity play in this strategy?
-Time-based liquidity involves observing previous day or week highs and lows to determine whether the market has taken out these levels. A failure to displace through these levels can signal a possible reversal.
How do you confirm a potential reversal when using this strategy?
-A potential reversal is confirmed by watching for displacement or failure to displace around key time-based liquidity levels, like previous day highs or lows, along with the market's reaction to these levels.
Why is it important to start analysis on higher time frames?
-Starting analysis on higher time frames, like the weekly chart, helps identify the most recent areas of liquidity (external range liquidity) and fair value gaps, providing a clearer overall market direction.
How does lower time frame structure help in confirming bias?
-Lower time frame structure helps by identifying market shifts in real time, allowing for more precise entries once higher time frame bias is established.
What should traders focus on when the market trades below lows during a bullish bias?
-When the market trades below lows during a bullish bias, traders should look for opportunities to buy, treating these moments as potential opportunities rather than signs of weakness, particularly when market structure shifts confirm a reversal.
Outlines

Этот раздел доступен только подписчикам платных тарифов. Пожалуйста, перейдите на платный тариф для доступа.
Перейти на платный тарифMindmap

Этот раздел доступен только подписчикам платных тарифов. Пожалуйста, перейдите на платный тариф для доступа.
Перейти на платный тарифKeywords

Этот раздел доступен только подписчикам платных тарифов. Пожалуйста, перейдите на платный тариф для доступа.
Перейти на платный тарифHighlights

Этот раздел доступен только подписчикам платных тарифов. Пожалуйста, перейдите на платный тариф для доступа.
Перейти на платный тарифTranscripts

Этот раздел доступен только подписчикам платных тарифов. Пожалуйста, перейдите на платный тариф для доступа.
Перейти на платный тарифПосмотреть больше похожих видео
5.0 / 5 (0 votes)


