Stop trading Candlestick charts... Do this instead.
Summary
TLDRIn this video, the presenter delves into the intricacies of footprint charts, emphasizing their role in enhancing market understanding for traders. By visualizing buyer and seller dynamics within candlestick patterns, these charts reveal the underlying auction processes. The presenter discusses key concepts such as bid-ask relationships, market aggression, and the importance of unfinished auctions in predicting price movements. While highlighting that footprint charts are not a one-size-fits-all solution, the video encourages traders to integrate these tools with broader market insights. Ultimately, the content aims to enrich trading strategies by fostering a deeper comprehension of market participant behavior.
Takeaways
- 😀 Context is crucial in trading; understanding market dynamics enhances decision-making.
- 📊 Tools like market profile and footprint charts are essential for analyzing market balance and auction activity.
- 🔍 It’s important to know how and where to incorporate trading tools based on individual trading styles.
- 🎯 No single trading tool guarantees success; understanding your approach is key.
- 🖼️ Trading is an art that involves interpreting market participants' actions to formulate strategies.
- 📈 Knowing the participation of market players helps in making informed trading decisions.
- 🛠️ Familiarizing oneself with auction mechanics is necessary before applying trading rules.
- 🗣️ The speaker encourages audience engagement and topic suggestions for future videos.
- ⏳ The speaker appreciates the audience's patience regarding video uploads and acknowledges delays.
- ✨ Continuous learning and adaptation are vital for success in trading.
Q & A
What is the primary focus of the video?
-The video focuses on understanding market dynamics through tools like Market Profile and footprint charts, emphasizing the need for traders to analyze auction activity and market balance.
How do footprint charts assist traders?
-Footprint charts help traders visualize the activity within the market auction, allowing them to see where trading volume occurs at different price levels.
What does Market Profile indicate?
-Market Profile provides insights into where the market is balanced or imbalanced, helping traders identify potential support and resistance levels.
What is the speaker's stance on the tools mentioned?
-The speaker views these tools as beneficial for understanding market conditions but stresses that they are not foolproof solutions or the only tools traders need.
What should traders understand before using these tools?
-Traders should have a foundational understanding of market auctions, participant involvement, and how to incorporate these tools into their trading strategies.
How does the speaker describe trading?
-The speaker describes trading as an art, where the goal is to read market participants' actions and construct a narrative to inform trading decisions.
What advice does the speaker give regarding trading strategies?
-The speaker advises traders to know what they are looking for when applying these tools and to integrate them appropriately into their trading approach.
What does the speaker invite viewers to do?
-The speaker invites viewers to suggest topics they would like covered in future videos, indicating a willingness to engage with the audience.
What can traders gain from understanding auction dynamics?
-By understanding auction dynamics, traders can better interpret market movements, identify potential trading opportunities, and improve their overall trading performance.
Why does the speaker apologize at the end of the video?
-The speaker apologizes for the delay in uploading the video, expressing appreciation for the audience's patience and support.
Outlines

Этот раздел доступен только подписчикам платных тарифов. Пожалуйста, перейдите на платный тариф для доступа.
Перейти на платный тарифMindmap

Этот раздел доступен только подписчикам платных тарифов. Пожалуйста, перейдите на платный тариф для доступа.
Перейти на платный тарифKeywords

Этот раздел доступен только подписчикам платных тарифов. Пожалуйста, перейдите на платный тариф для доступа.
Перейти на платный тарифHighlights

Этот раздел доступен только подписчикам платных тарифов. Пожалуйста, перейдите на платный тариф для доступа.
Перейти на платный тарифTranscripts

Этот раздел доступен только подписчикам платных тарифов. Пожалуйста, перейдите на платный тариф для доступа.
Перейти на платный тарифПосмотреть больше похожих видео

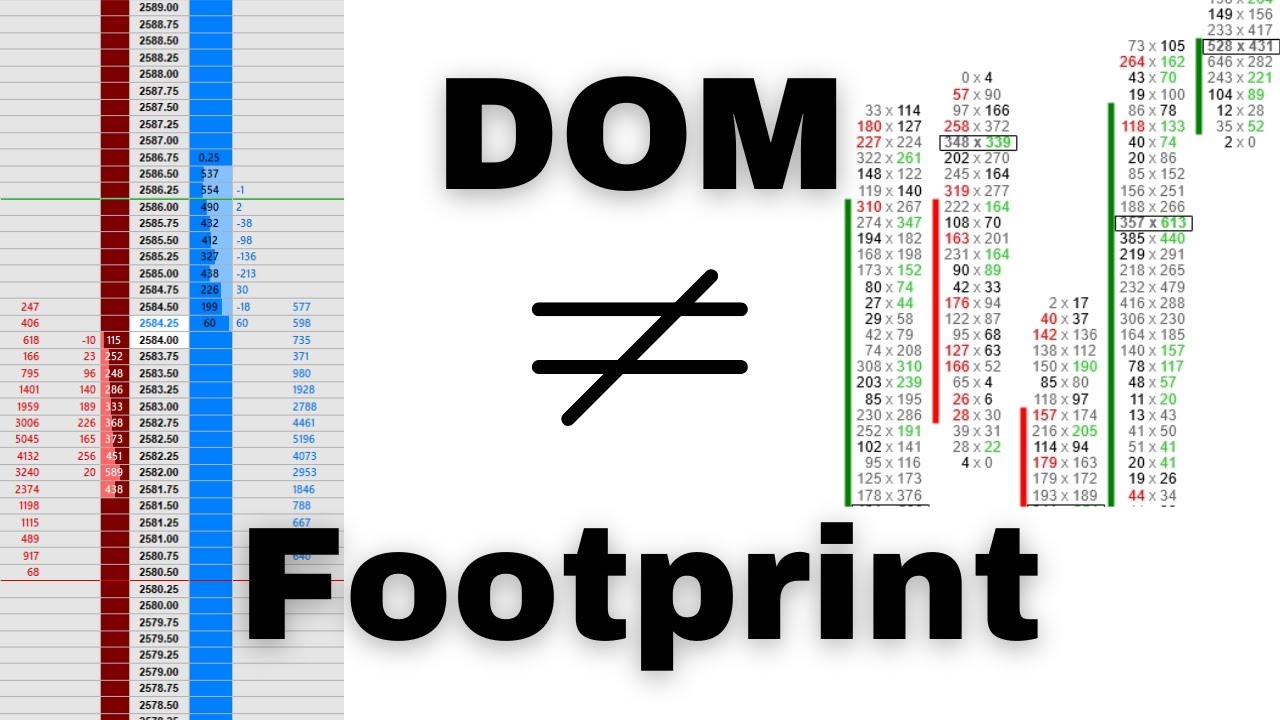
Understanding The Differences Between a DOM and Footprint Chart

Market Profile: Course Introduction

Mastering Order Flow To Make Money Trading (2023)

The U.S. Plan to Collapse the Dollar (It’s Not What You Think)

Liquidity Pools - A-Z Guide Episode 6

Absorption In The Order Flow On Moves Up How To See It In The Delta And Imbalances
5.0 / 5 (0 votes)
