Futures Trading, Best trading leading indicator for crypto

Vusi Designer
6 Dec 202205:38

Summary

TLDRThis video introduces the 'Control Indicator,' a sentiment-based tool for trading futures markets, previously exclusive to exchanges and brokers. It reveals the ratio of long to short positions, offering insights into market sentiment. By identifying significant discrepancies in these positions, traders can make contrarian moves, potentially profiting from the majority's misjudgment. The indicator, which doesn't trigger frequently, requires monitoring to spot opportunities and is complemented by a free course on derivatives trading available on YouTube.

Takeaways

  • 📈 The video introduces a leading indicator for trading the Futures market, which was previously only available to exchanges and brokers.
  • 🆓 This indicator is now accessible for free thanks to decentralized trading protocols.
  • 🔍 The indicator is called the 'control indicator' and is sentiment-based, meaning it relies on the behavior and opinions of traders.
  • 🔄 The term 'contrarian' is defined as someone opposing or rejecting popular opinion, especially in stock exchange dealing.
  • 📊 The control indicator can be used by observing the open interest in long and short positions and identifying significant discrepancies.
  • 📉 The majority of traders (over 95%) tend to lose money, suggesting that going against the majority can be profitable.
  • 📅 The video references a specific live stream on November 27th, where a significant discrepancy in open interest was observed, leading to a market drop.
  • 📝 The control indicator does not provide signals frequently, but keeping an eye on the stats can help spot trading opportunities.
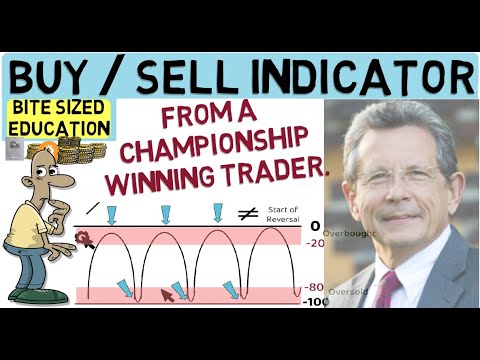
  • 📈 A high ratio of long to short positions (or vice versa) can signal a potential market reversal, which can be used as a trading opportunity.
  • 📚 The video mentions a free course on YouTube for those unfamiliar with trading derivatives.
  • 🔗 The presenter offers links to join a Discord group and use the same trading platform as them for further trading insights and community.

Q & A

  • What is the main topic of the video?

    -The main topic of the video is about using the 'control indicator' as a leading indicator for trading in the Futures market.

  • Why was the information discussed in the video previously only available to exchanges and brokers?

    -The information was previously only available to exchanges and brokers because it involved seeing how many people were going long or short and where they were placing their stop losses, which was not accessible to the general public.

  • What does the term 'contrarian' mean in the context of trading?

    -In the context of trading, 'contrarian' refers to a person who opposes or rejects popular opinion, especially in stock exchange dealing.

  • How can the control indicator be used as a trading strategy?

    -The control indicator can be used as a trading strategy by identifying a high discrepancy in the ratio of long to short positions, suggesting that the majority of traders are wrong, and then trading in the opposite direction.

  • What is the significance of the open interest in long and short positions?

    -The open interest in long and short positions is significant because it shows the number of contracts that are open and have not been closed or delivered, which can indicate market sentiment and potential future price movements.

  • What was the discrepancy in open interest between long and short positions on the 27th of November 2022?

    -On the 27th of November 2022, the discrepancy in open interest was approximately 170 million in long position and only 58 million in short position.

  • How did the market react to the high discrepancy in open interest on the 27th of November 2022?

    -The market reacted by dropping heavily, as the majority of traders were bullish, and the market did the exact opposite, serving as a confirmation of the control indicator's effectiveness.

  • What is the recommended ratio or discrepancy for using the control indicator effectively?

    -The recommended ratio or discrepancy for using the control indicator effectively is at least two to three or four times higher than the other number of long or short positions.

  • How often does the control indicator provide trading opportunities?

    -The control indicator does not provide trading opportunities frequently; it might come once in two weeks, so it's important to keep an eye on the stats for spotting opportunities.

  • What additional resources does the video offer for those interested in trading the derivatives market?

    -The video offers a dedicated free course on YouTube for those interested in trading the derivatives market, as well as links to join a Discord group for further trading insights and community.

Outlines

00:00

📈 How to Use a Free Leading Indicator for Futures Trading

This video introduces a powerful, free-to-use leading indicator for trading in the Futures market. Historically, access to this data was limited to exchanges and brokers, who could track traders' positions, but thanks to decentralized trading protocols, this information is now available to all. The indicator, called the 'control indicator,' helps traders by showing the sentiment in the market—how many traders are going long or short and where they place their stop losses. The key concept discussed is that the majority of traders often lose money, so by doing the opposite of the popular opinion, one can gain an advantage in the market. The video references a live stream from November 27, 2022, where this indicator accurately predicted a market drop by analyzing the disparity in long and short positions.

05:01

📚 Free Course on Derivatives Market Trading

The second part of the video offers viewers access to a free course on how to trade in the derivatives market, available on YouTube. The course is designed for those who are unfamiliar with derivatives trading. The presenter also invites viewers to join their trading community via Discord, which will soon be available. Additionally, viewers are encouraged to follow along with the presenter’s trades by using the same broadcasting software, with links provided in the video description. The video concludes with an expression of gratitude and a promise of more helpful content in future videos.

Mindmap

Keywords

💡Futures Market

The Futures Market is a financial exchange where participants can buy and sell contracts for the purchase or sale of a specific asset at a predetermined price at a specified time in the future. In the context of the video, it is the main subject of trading where the 'Control Indicator' is applied to predict market movements based on the sentiment of the majority of traders.

💡Control Indicator

The Control Indicator is a sentiment-based tool mentioned in the video that measures the ratio of long to short positions in the market. It is used as a leading indicator to predict market trends by identifying when the majority of traders are likely wrong, thus suggesting a contrarian trading strategy.

💡Sentiment Analysis

Sentiment Analysis in the video refers to the process of gauging the overall sentiment of the market, which in this case is done by analyzing the number of long and short positions. It is crucial for understanding the market's prevailing opinion and using it as a contrarian indicator to make trading decisions.

💡Contrarian

A contrarian is an individual who opposes or rejects popular opinion, especially in the context of stock exchange dealing. The term is used in the video to describe a trading strategy that goes against the majority, which is often considered beneficial given that over 95% of traders typically lose money.

💡Open Interest

Open Interest in the video represents the total number of outstanding contracts that have not been settled. It is a key metric used with the Control Indicator to determine the ratio of long to short positions, which helps in identifying potential market reversals.

💡Long Position

A Long Position is a stance in trading where an investor expects the price of an asset to rise. In the video, the number of long positions is compared with short positions to find discrepancies that might indicate a market trend reversal.

💡Short Position

A Short Position is the opposite of a long position, where an investor expects the price of an asset to fall. The video discusses how the Control Indicator uses the ratio of long to short positions to predict market movements.

💡Discrepancy

In the context of the video, discrepancy refers to the significant difference between the number of long and short positions. A high discrepancy can be a signal for a potential market reversal, which is a key aspect of using the Control Indicator.

💡Derivatives Market

The Derivatives Market is a financial market where participants trade contracts that derive their value from the underlying assets. The video suggests that understanding this market is essential for effectively using the Control Indicator and making informed trading decisions.

💡Decentralized Trading Protocols

Decentralized Trading Protocols, as mentioned in the video, are systems that allow for the exchange of financial assets in a decentralized manner, often leveraging blockchain technology. They have made previously exclusive market data, like the Control Indicator, accessible to a broader audience.

💡Trading Opportunity

A Trading Opportunity in the video is a moment when the Control Indicator shows a significant discrepancy between long and short positions, indicating a potential market reversal. The presenter suggests that recognizing these opportunities can lead to profitable trades by going against the majority.

Highlights

The video introduces the 'Control Indicator' as a leading indicator for trading the Futures market.

Historically, the data for the Control Indicator was only accessible to exchanges and brokers.

Decentralized trading protocols have made this data available to the public.

The Control Indicator is a sentiment-based indicator, meaning it opposes or rejects popular opinion in trading.

Using the Control Indicator involves analyzing the ratio of long to short positions in the market.

A high discrepancy in long vs. short positions can signal a market reversal.

The video demonstrates how a high open interest in long positions can lead to a market crash due to the majority being wrong.

The Control Indicator can be used to make contrarian trades against the majority of traders.

The indicator does not provide signals frequently, but keeping an eye on the stats can reveal trading opportunities.

A significant ratio of long to short positions, such as 3:1, can be used as a signal for contrarian trading.

The video provides a real-world example of using the Control Indicator from a live stream on November 27th, 2022.

Market crashes can be predicted by observing when the majority of traders are overly bullish.

The video emphasizes the importance of doing the opposite of what the majority of traders are doing for success.

The presenter offers a free course on YouTube for those interested in trading the derivatives market.

Viewers are encouraged to join a Discord group for more trading insights and community interaction.

The video concludes with a reminder of the importance of understanding market sentiment and the derivatives market.

The presenter thanks viewers and invites them to watch future videos for more trading strategies.

Transcripts

play00:00

in this video I share with you the best

play00:01

leading indicator when it comes to

play00:03

trading the Futures market and the best

play00:04

part about it it's all for free you see

play00:07

for a very long time this information

play00:08

was only available to you know exchanges

play00:12

and Brokers they could see how many

play00:13

people are going long and how many

play00:14

people are going short and where exactly

play00:17

they're putting in their stop loss and

play00:19

we couldn't really access the

play00:20

information and use it to our advantage

play00:23

until now thanks to decentralized

play00:26

trading protocols we can now see all

play00:28

this data and in this video we're going

play00:29

to be looking at this data and looking

play00:31

at how can we profit from this

play00:33

information by using this as a leading

play00:36

indicator when it comes to trading the

play00:38

Futures Market the name of this

play00:39

indicator is called control indicator

play00:41

now if you come to indicators here on

play00:44

your charting software and come here to

play00:46

type controlion

play00:49

and you realize that the indicator is

play00:51

not dead and that is simply because this

play00:53

is a sentiment based indicator what does

play00:56

that mean in order for us to really

play00:57

understand what we're getting into here

play01:00

let's first look at the definition of

play01:02

the word contrarian now the definition

play01:04

of the word contrarian means that a

play01:06

person who opposes or rejects popular

play01:08

opinion especially in stock exchange

play01:11

dealing let's look at the adjective that

play01:13

says opposing or rejecting popular

play01:15

opinion or current practice so how can

play01:19

we use this control indicator when we're

play01:22

actually trading now it's actually very

play01:24

simple because I already showed you this

play01:25

indicator on my live stream and that

play01:28

stream was on the 27th of November

play01:30

basically just a couple of days ago and

play01:33

on that stream I showed you the number

play01:35

of open interest on long and short

play01:37

position because that's exactly what

play01:39

we're talking about here you can find

play01:41

the ratio or the discrepancy within this

play01:43

number as high as two to one or one to

play01:46

three and we can use that as a

play01:48

controlling in the cater because that

play01:50

means the majority of people are

play01:52

thinking something on the market where

play01:54

else we should be doing the exact

play01:55

opposite we already know that over 95

play01:58

percent of Traders lose money on the

play02:01

market so that means that a majority of

play02:03

Traders on the market are in most cases

play02:05

always wrong so if we do the exact

play02:09

opposite of what the majority of Traders

play02:11

are doing we most likely will succeed as

play02:14

you can see now we can be able to see

play02:15

the open interest and see how many

play02:18

people are going along and how many

play02:19

people are going short if we look at the

play02:21

data right now if I come here

play02:23

and maybe let's just come to this one

play02:25

here you can see here we've got a short

play02:28

position and long position but right now

play02:30

you know the discrepancy is not that

play02:32

high we've got 70 million and 45 million

play02:34

however about a week ago as you can see

play02:38

from this stream we had a total of about

play02:40

170 million in open interest that means

play02:43

in Long position and only 58 million in

play02:46

short position

play02:48

so I did tell you on this very stream

play02:51

that this is a good indicator that now

play02:54

the market is going to turn to the

play02:55

opposite direction if we actually look

play02:57

at the chart you can see here the date

play02:59

was 27 of November in 2022. now if I

play03:02

come to the charts here you can

play03:04

basically just look at any assets from

play03:06

here you can see if I scroll down here

play03:08

you can see on the 27th of November you

play03:11

can see that the market immediately

play03:13

dropped

play03:15

heavily you can see that it crashed

play03:17

simply because a majority of Traders at

play03:20

that time were very very bullish so the

play03:24

market did the exact opposite remember

play03:26

we said over 95 percent of Traders lose

play03:28

money when trading so as a controlling

play03:31

indicator what we do is that we do the

play03:33

exact opposite if we find this number to

play03:36

be way way higher than the other number

play03:38

so how do we use a controlling indicator

play03:40

it's very simple we're basically looking

play03:42

at long position and short position and

play03:45

if the discrepancy between these two

play03:48

number or the ratio is way too high for

play03:50

example if we look at this stream here

play03:52

at that time we had 127 million in Long

play03:55

position with only 58 million in short

play03:58

position as we said before in most cases

play04:01

the majority of Traders are always wrong

play04:04

so once the number of long and short

play04:06

position has a ratio of you know three

play04:08

times the opposite of the number that's

play04:10

when we can use that to our advantage

play04:12

and do the exact opposite of what

play04:14

majority of Traders us are doing so

play04:16

that's what I wanted to bring to your

play04:17

attention obviously this indicator

play04:19

doesn't you know flash every time so it

play04:22

will come maybe once in two weeks but

play04:24

the more you keep an eye on these stats

play04:27

here that's when you can actually be

play04:28

able to spot this trading opportunity

play04:30

and maybe jump in when you see a big

play04:32

discrepancy between the two numbers and

play04:34

then you can make money with doing the

play04:37

exact opposite of what the majority are

play04:39

doing but just remember that the number

play04:40

has to be at least two to three or four

play04:43

times higher than the other number of

play04:45

long or short position that's when you

play04:48

can actually use this indicator to

play04:50

either go long or go short on the market

play04:52

and obviously it helps to know the

play04:54

overall sentiment of the market and

play04:56

having a clear understanding of how to

play04:58

trade the derivatives Market if you have

play05:01

no idea of how to trade the derivatives

play05:03

of Market well you are lucky because I

play05:05

have a dedicated course which is

play05:07

absolutely for free right here on

play05:09

YouTube and you can find it showing up

play05:11

on the pop-up right now if you want to

play05:13

trade alongside with me always use the

play05:14

links in this option of this video to

play05:16

the broadcast that I'm actually using so

play05:19

you can also use that to actually join

play05:21

our Discord group more information about

play05:23

that is coming soon or maybe by the time

play05:25

you're watching this I would have

play05:26

published the Discord group server as

play05:28

well so thank you so much for watching I

play05:30

will see you guys on the next one and

play05:32

hopefully you'll find this video very

play05:34

very helpful and I will see you on the

play05:36

next video goodbye for now

Rate This

5.0 / 5 (0 votes)

関連タグ
Control IndicatorFutures TradingSentiment AnalysisContrarian StrategyMarket AnalysisTrading IndicatorsOpen InterestLong-Short RatioDecentralized ProtocolsTrading StrategiesFree Course
英語で要約が必要ですか?