Model Monitoring with Sagemaker
Summary
TLDRThis webinar discusses model monitoring in production environments using AWS SageMaker. It covers the importance of monitoring model performance, the concept of model drift, and how SageMaker helps detect data quality and model accuracy issues. The session also includes a case study on implementing custom model monitoring for a security application.
Takeaways
- 😀 Model monitoring is crucial for tracking the performance of machine learning models in production environments and identifying when they are not performing as expected.
- 🔍 Model drift refers to the decline in a model's performance over time due to changes in data or the environment, which can be categorized into data drift, bias drift, or feature attribution drift.
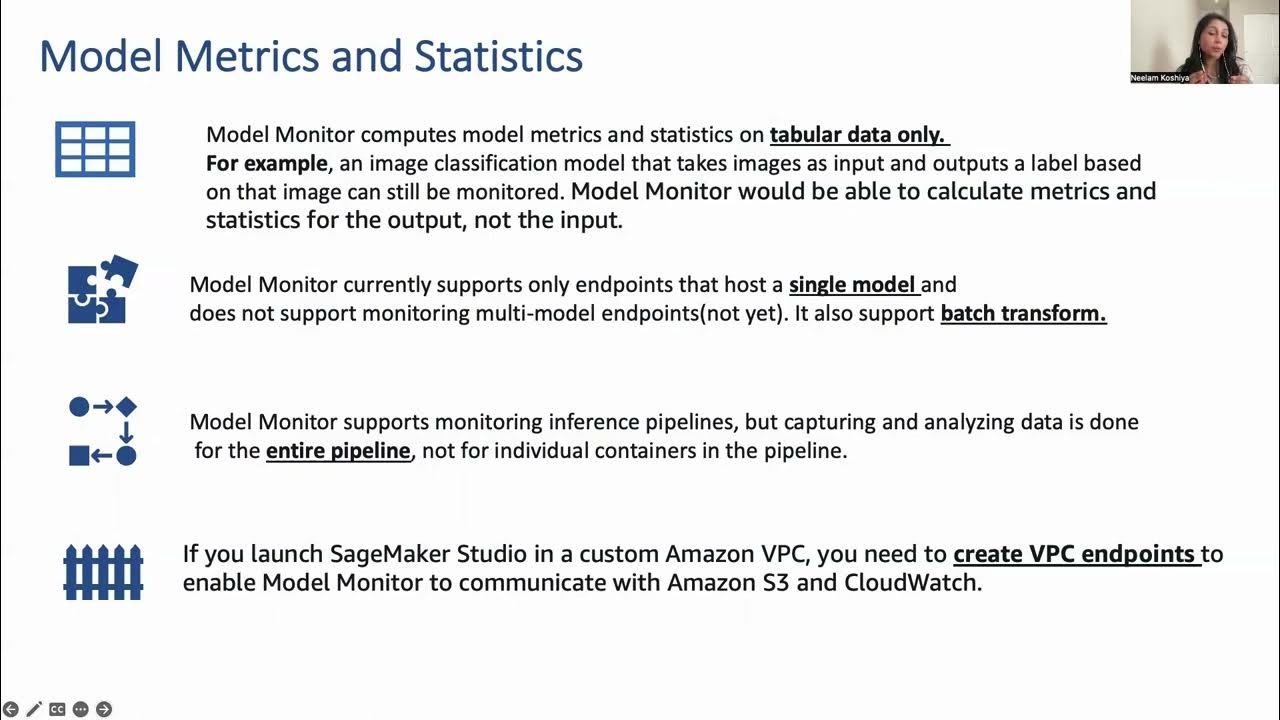
- 🛠 AWS SageMaker offers tools for model monitoring that can help detect issues like data quality, model quality, bias, and explainability, with SageMaker Clarify being a key tool for bias and explainability.
- 📈 Establishing a baseline for model performance metrics is essential for model monitoring, allowing for the comparison of current performance against expected standards.
- 🔒 Data capture is a critical component of model monitoring, involving the collection of both the data sent to the model and the ground truth labels for model quality monitoring.
- 📊 Model monitoring jobs can be scheduled to detect data quality drift and model accuracy, with results and alerts made available in S3, SageMaker Studio, and CloudWatch for action.
- 👷♂️ Best practices for model monitoring include keeping instance utilization below 70% to ensure effective data capture and maintaining data in the same region as the model monitoring.
- 📝 The architecture of data capture involves a training job, a model endpoint, a baseline processing job, and a monitoring job that captures and analyzes data quality and model predictions.
- 📉 Monitoring for data quality involves checking for violations such as missing or extra columns, unexpected data types, or a high number of null values, which can trigger CloudWatch alerts.
- 🎯 Model quality monitoring requires ground truth labels to compare predictions with reality, using metrics like RMSC or F1 score to evaluate accuracy and prediction quality.
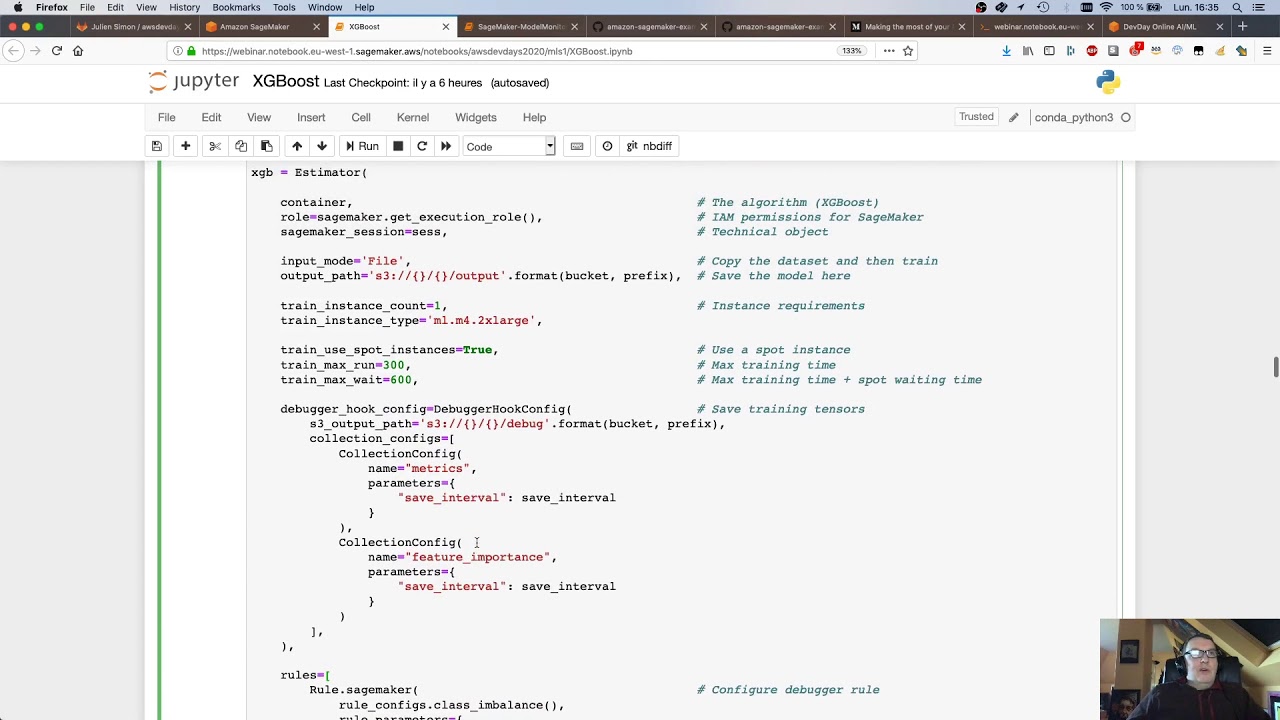
- 🔧 Custom model monitor scripts can be created for specific needs, deployed as Docker containers in AWS ECR, and scheduled to run at intervals to capture and analyze custom metrics.
Q & A
What is model monitoring?
-Model monitoring is the process of monitoring your model's performance in a production-level environment. It involves capturing key performance indicators that can indicate when a model is performing well or not, helping to detect issues like model drift.
Why is model monitoring necessary?
-Model monitoring is necessary because when machine learning models are deployed to production, factors can change over time, causing the model's performance to drift from the expected levels. Monitoring helps detect these changes and ensures the model continues to perform as intended.
What is model drift?
-Model drift refers to the decay of a model's performance over time after it has been deployed to production. It can be caused by changes in the data distribution (data drift), changes in the data that the model sees compared to the training data (bias drift), or changes in the features and their attribution scores (feature attribution drift).
What are the different types of model monitoring?
-The different types of model monitoring include data quality monitoring, model quality monitoring, bias monitoring, and explainability monitoring. These aspects help ensure the model's predictions are accurate and unbiased, and that the model's decisions can be explained.
How does SageMaker help with model monitoring?
-SageMaker provides tools and services for model monitoring, including the ability to capture data, establish baselines, and schedule model monitoring jobs. It can detect data quality drift, model accuracy, and other issues, with findings made available in S3 and visualized in SageMaker Studio.
What is the lifecycle of model monitoring in SageMaker?
-The lifecycle of model monitoring in SageMaker involves deploying a model, enabling data capture, collecting ground truth data, generating a baseline, scheduling model monitoring jobs, and taking action based on the findings, such as retraining the model if necessary.
What are some best practices for model monitoring in production?
-Best practices include keeping instance utilization below 70% to avoid reduced data capture, ensuring data captured for monitoring is in the same region as the model monitoring, and using lowercase variables with underscores to ease parsing in JSON and Spark jobs.
How can custom metrics be used in SageMaker model monitoring?
-Custom metrics can be used by developing a script, packaging it in a Docker container, and deploying it as a custom model monitor metric in AWS. This allows for monitoring specific aspects of model performance that are not covered by standard metrics.
What is the role of CloudWatch in SageMaker model monitoring?
-CloudWatch plays a crucial role in SageMaker model monitoring by receiving alerts and metrics from the monitoring jobs. These alerts can trigger actions, such as retraining the model or adjusting the model's parameters, based on the detected issues.
How can AWS Proof of Concept (PoC) funding support machine learning initiatives?
-AWS offers PoC funding for machine learning projects in partnership with aligned partners. This funding can cover up to 10% of the annual reoccurring revenue, with a one-time cap of $25,000, to support the evaluation and development of machine learning solutions.
Outlines
🔍 Introduction to Model Monitoring with SageMaker
This paragraph introduces the webinar's focus on model monitoring within AWS SageMaker. It discusses the common challenges faced post-deployment of machine learning models, emphasizing the importance of model monitoring to track performance in a production environment. Model drift, which can occur due to changes in data distribution or model bias, is identified as a key issue. The speaker transitions to a deeper exploration of model drift and its solutions using AWS SageMaker.
📈 Understanding Model Monitoring and Data Quality
The second paragraph delves into the specifics of model monitoring, highlighting the importance of monitoring both data and model quality. It explains the significance of establishing a baseline for statistical properties and the role of business rules in this process. The paragraph also touches on the best practices for data capture and monitoring, including the importance of keeping instance utilization below 70% and ensuring data is captured in the same region as the model monitoring for consistency.
🛠️ Model Quality Monitoring and Violation Checks
This section discusses the model quality monitoring process, which requires ground truth labels to assess the accuracy of predictions against actual outcomes. It describes the architecture of data capture and the workflow for monitoring, including the establishment of baselines, violation checks for data integrity, and the use of CloudWatch alerts for taking action on detected issues. The paragraph also outlines the types of violations that can occur and how they are managed.
📊 Model Accuracy and Custom Metrics in Monitoring
The focus shifts to model accuracy and the use of custom metrics for monitoring. It describes a scenario where a client, SecurToad, requires constant monitoring of a machine learning model with custom metrics. The solution involves using the Jensen Shannon Divergence metric to measure distribution changes in model scores, which can indicate the need for retraining. The paragraph outlines the process of creating a Python script for this metric and deploying it as a custom model monitor in AWS.
🔧 Automating Model Monitoring with AWS and GitHub Actions
This paragraph explains the automation of the model monitoring process using AWS services and GitHub Actions. It details the creation of a Docker container image for the custom model monitor script and the deployment pipeline to AWS ECR. The paragraph also describes the integration of the model monitor into the ML training pipeline, including steps for training jobs, endpoint configurations, and the setup of model monitoring jobs that run hourly.
📚 Conclusion and PoC Funding Opportunities
The final paragraph wraps up the webinar by summarizing the solution created for SecurToad and introducing the concept of AWS Proof of Concept (PoC) funding. It explains how AWS and partners like Metal Toad can support the evaluation of machine learning initiatives with funding up to $25,000. The paragraph concludes with an invitation for further questions and a brief mention of best practices for using SageMaker Model Monitor effectively.
❓ Q&A Session on SageMaker Model Monitoring
The last part of the script is a Q&A session where participants ask about best practices for using SageMaker Model Monitor and how it captures and stores data required for monitoring and analysis. The responses provide insights into the technical aspects of model monitoring scripts, their similarity to Lambda functions, and the use of environmental variables within the scripts.
Mindmap
Keywords
💡Model Monitoring
💡Production Environment
💡Model Drift
💡Data Quality
💡Model Quality
💡Bias Drift
💡Feature Attribution Drift
💡SageMaker Clarify
💡Data Capture
💡Jensen Shannon Divergence
💡Proof of Concept (POC) Funding
Highlights
Webinar discusses model monitoring with SageMaker, focusing on maintaining ML solution performance in production environments.
Model monitoring involves capturing key performance indicators to assess model performance and detect issues.
Model drift is identified as a significant challenge, causing model performance to decay over time in production.
Data drift and bias drift are explained as types of model drift, affecting model accuracy due to changing data distributions.
Feature attribution drift is introduced as a change in the importance of features over time, impacting model performance.
Model monitoring is crucial for detecting when a model needs retraining, optimizing resource use and maintaining performance.
SageMaker Clarify is highlighted as a tool for model explainability and bias detection, integrating with model monitoring.
Data quality monitoring is discussed, emphasizing the importance of capturing data sent to the model and ground truth labels.
Establishing a baseline for model quality and data quality is crucial for detecting drift and maintaining model accuracy.
Model monitoring jobs are scheduled to detect data quality drift and model accuracy, with results available in S3 and visualized in SageMaker Studio.
Best practices for model monitoring include keeping instance utilization below 70% to ensure effective data capture.
The architecture of data capture is detailed, explaining the flow from training data to model deployment and monitoring.
Violation checks for data quality are described, including checks for missing columns, extra columns, and unexpected null values.
Model quality monitoring requires target variables and involves capturing labeling data to assess model predictions.
Jensen Shannon Divergence is introduced as a metric for measuring distribution differences, used for custom model monitoring.
A custom model monitor script is developed using Python and deployed as a Docker container image to AWS ECR for model monitoring.
A step function is used in the ML training pipeline to automate model training, deployment, and monitoring for continuous improvement.
AWS offers proof of concept funding for machine learning initiatives, supporting up to 10% of one year's annual reoccurring revenue.
Best practices for using SageMaker Model Monitor include using lowercase variables and VPC endpoints for ease of integration.
Data capture configuration in SageMaker allows defining an S3 upload path and setting a sampling percentage for data analysis.
Model monitor scripts are similar to Lambda functions, with environmental variables set up for script execution.
Transcripts
so today's webinar will be about model
monitoring with
sagemaker so clients often face the
following problem once my ml solution is
deployed to a production level
environment how do I know if my ml
solution is
working the solution model
monitoring what is model monitoring
model monitoring is the process of
monitoring your model performance in the
production level environment and this
means capturing key performance
indicators that can tell you when a
model is doing well and when it's doing
not so why do I need model monitoring
when deploy machine learning models to
production there are S factors that can
change over time the model may start to
drift from the performance You're
Expecting when you deployed it the data
being fed into your model may change
over time depending on your use case the
second model is deploy to production you
already are going to need to get ready
to retrain and redeploy
it so what is exactly model drift model
drift is the decay of a model's
performance over time once it's deployed
to production model drift may be called
Data drift the data distribution that is
being fed into your ml model changes
over time or bias drift if a type of is
a type of model drift that occurs if the
data that you use to train your model is
different compared to the data your
model sees in production and feature
attribution drift is the drift of the
features being used in your ml model and
their attribution scores which can
change over time depending on the data
that's being fed in but at the core
model drift is caused by changes in your
data and now I'll hand us over to proi
to give us a deep dive into solving
these specific model drift problems
using AWS sagemaker
thanks Ray uh so let's go to the next
slide okay now Reay has already covered
why we need the model monitoring
basically as he mentioned model
monitoring is monitoring the model in
production we can um keep on I mean if
you don't want to model the
monitor monitor the model another way of
doing it is keep on retraining the model
but continuous retraining does not solve
issues and as well as it needs a lot of
resources so retraining only when
necessary is what you should aim for and
that's where the model monitor is going
to help you if you can go to the next
slide as mentioned uh already there are
these types of uh model uh monitoring
the data quality the model quality the
bias and
explainability uh basically the data
quality has a lot of uh for example a
lot lot of Statistics mentioned here
mean and sum and standard deviation Etc
where uh and I'm going to go into a
little bit more detail about that but
those are the criteria on which the data
will be examined the other one is the
model quality where your model is
predicting something and how does that
prediction compare with the actual
reality and that's where we are looking
at the model quality and of course the
rmsc or the F1 score Etc are the uh
metrics used used for the accuracy and
prediction the other one is bias re
already mentioned about it and then the
model explainability I should mention
that for model bias and model
explainability the sage maker clarify is
a tool that we are we use typically
because clarify is used for model
explainability and it wonderfully
integrates with the model monitoring
service so you can basically use the
sage model Monitor and further use
clarify to talk about the bias and
explainability in today's presentation
I'm majorly going to focus on the data
quality and the model quality and let's
do that if you can go to the next
slide okay so this is typically the life
cycle of model monitoring uh what we are
going to do is uh we need a model that
is deployed of course which is deployed
in production and we need to enable the
data capture now this data capture is in
two ways one is you are capturing the
data which is um sent to the model and
uh there is a specific way you enable in
in the sagemaker API where you enable
the data capture uh and the other one is
for and we call it ground truth data I
will be referring it to to it as ground
truth it does not mean sagemaker ground
truth it's just the ground truth data so
the other data that you're going to
capture is the ground truth labels and
this this data is something uh which is
needed for the model quality monitoring
and that is the data that the customer
the user will have to provide and I'll
explain a little bit more about that the
data quality monitoring does not need
the ground truth labels the model
quality monitoring model quality
monitoring will need the ground truth
labels but anyway basically you have a
model which is deployed then you collect
the ground truth based on which quality
that you are talking uh you're
mentioning then you generate a baseline
now for data quality as well as model
quality uh establishing a baseline of
statistics and mentioning the
constraints is an important step in um
uh the model monitoring where you
establish something against which the
quality of the model will be compared so
that the data drift or the accuracy
drift can be justified um can be
calculated and then um uh you schedule
the model model monitoring jobs uh which
will detect the data quality drift the
model accuracy Etc and those uh uh
findings are made available in S3 as
well as could be visualized in sagemaker
studio they're also sent to Cloud watch
on which further action depending on the
cloud watch alerts can be taken if you
can go to the next
slide okay so let's look at monitoring
data quality next slide please
so uh we looked at couple of statistical
properties uh for the independent
variables in the data that were
mentioned in the earlier slide they can
be mean mode Etc uh what you're going to
do is looking at the ground truth data
when you are establishing a baseline you
are going to have some business rules
the business rules could be
automatically suggested they could be um
also edited and updated by you uh and
then once those uh business rules are
set basically a baseline will be
established looking at your uh sent uh
looking at your initial ground truth
data again I'm not looking at the
predicted variable I'm just looking at
the data now the best practices for this
type of Baseline generation and further
data quality is that the S3 in which the
data is captured um the initial data as
well as later on the data which is
captured by the model during model
monitoring should be in the same region
of course as the model monitoring and
both for model monitor model quality
Monitor and data quality monitor the
instance utilization should be something
that you should watch for uh you should
not have the instance uh utilization
above 70% because many times Sage maker
tends to uh reduce the data capture if
the instance utilization is above 70 so
those are the and then uh of course the
model monitoring Effectiveness kind of
goes down so
uh this is where uh you should uh these
are some of the best practices um if you
can uh go to the next slide uh when we
look at the yeah this is the diagram
that depicts the architecture of the
data capture uh you have the training
data using the training data uh and
sagemaker training job there is a model
that is generated a train and it is
enabled as a sagemaker endpoint now you
also have a Baseline processing job
which looking at your business rules it
has created a Baseline and various uh
mentioned various statistics suggested a
lot of constraints there is a small
group of users which is mentioned here
which shows that you can look at the
constraints and you can update the
constraints the business rules so to say
uh once the data the once the endpoint
is deployed the there are requests uh
for uh specific uh data production data
and predictions are made and there is a
modeling job there is a monitoring job
for the model monitor which is scheduled
which is going to uh s save all the
results and statistics and violations in
S3 so now when I'm talking about
violations those violations are of
course going to generate Cloud watch
alerts and metrics and depending on the
cloud watch alert you can decide to take
action maybe if it is a cloud watch
alert which says say for example the
data quality prediction the the the data
quality monitor shows me that the data
drift is more than 30% maybe that's the
time you decide to retrain the model and
that's where um uh looking at the
cloudwatch alert you can just um trigger
a job that is going to retrain the model
so this is about the data quality
monitoring workflow if you can go to the
next
slide some of the violation check types
are mentioned here so say for example
if the type of the data that is uh
getting sent to the model is is the same
on which the model was originally
trained is are there any missing columns
are there any extra columns are there
same categories are there more than um
uh more than expected number of nulls in
the data all of this can happen when
suddenly the data that is sent in the
production changes typical example given
is uh during the pandemic we suddenly
shifted the interactions to remote uh
from the inperson interactions so the
data that was sent to the models was
suddenly um and radically shifted so all
these violations are going to kind of
document the data quality that is coming
in for you and I talked about the cloud
was alerts these violations will show up
in the alerts and you can act on them
once they show up in cloud watch if you
can go to the next
slide next is the model mon monitor uh
model quality uh which is going to need
your target variables and I'll tell you
how if you can go to the next
slide this is about the model accuracy
so it's not just the data that is going
to shift it is the accuracy as well so
sometimes the data does not shift very
drastically but the business rules uh
are such that the accuracy of the model
uh in predicting the target variable
keeps on uh going below the established
thresholds for this what you want to do
is you want to capture the labeling data
as well now the data capture that is
enabled by Sage maker is going to
predict is going to capture the data
that you that the model predicted but
there also needs to be a way for the
model monitor to get an access to the
predicted variables of the model and
typically this is done uh doing human in
the loop or there are multiple ways of
doing that where in the production data
doing some sampling you are predicting
the variables and basically Sage maker
the target variables and basically
sagemaker is going to combine those
human predicted Target variables uh over
the period of time with the uh Target
variables predicted by Sage maker uh
model and uh execute a merge job and
then uh depending on um the results of
the merge compare the feature statistics
uh this is more elaborated in the
workflow uh on the next slide if you can
go there
oh sorry there's one more so these are
typically the okay these are typically
the uh quality metrics that that it is
compared against and of course depending
on whether it is multiclass
classification or binary classification
or regression models those are the
quality metrics that sagemaker model
monitoring is going to work off of if
you can go to the next
slide okay so here as depicted in the
diagram basically the initial part the
right hand side left hand side of part
of the diagram looks the same for data
quality and model quality uh you are
basically establishing a Baseline and
then uh what is happening is uh once the
labels are provided the ground truth
interface on the rightmost side that is
the uh the inference uh variables which
are shared by human in the loop and the
inference inputs are shared uh also by
the sage maker now in this case it is a
batch transform but it could be a real
time and point it could be a batch
transform as well um those two variables
are merged and the merg data is also
made available to you and uh a
monitoring job is going to monitor
results of the merged job and then the
workflow kind of goes similar um way the
data quality work goes where uh you can
look at the thresholds and the
statistics and a violation report is
generated in Cloud watch and you can
take action on that essentially this is
like uh looking at the overall model
quality and not just the data quality if
you can go to the next slide I think
that's the last one okay yeah so feel
free to stop uh feel free to ask
questions on any anything related to the
sagemaker model monitoring and I can
answer
those great thank you proy uh I'll now
be showing us how we used uh some of the
tools that proy had described to solve a
particular client ml
problems so security toad came to us
with a deployed machine learning model
in production that needed to be
constantly monitored for performance to
ensure that their product was working
consistently for all their clients the
metrics that they needed to monitor were
custom and needed to be monitored every
hour secur out's application takes in as
input cloudfront logs from its clients
and uses an ml algorithm to determine
whether activity on one of their client
sites is malicious or
not and secur system is is adjustable
and also allows their clients to adjust
the sensitivity of their system by
setting thresholds to Auto Blacklist
malicious IP addresses so our client
needed a way to monitor their model and
production and monitor it every hour uh
with a custom metric for this particular
algorithm this is the solution that we
created for them secur Do's model needs
to perform well across a wide range of
clients so in order to do this we'll
need a model that is monitor across the
performance on multiple clients of the
same algorithm so the model that they
have essentially produces scores which
can be used to generate a distribution
of scores on site activity similar to
the curve that you see on the right if
this distribution of scores drifts and
takes a different form over time then
the model may need to be retrained then
the question became what metric do we
need to use to capture this specific
kind of drift
and was this something that we needed a
custom script for so we chose to use a
metric called Jensen Shannon Divergence
which measures the difference between
two distributions on a scale from 0 to
one closer the number is to one more
dissimilar the distributions are the
closer the number is to zero the more
similar they are the score is zero they
are completely the same if it's one
they're completely different this gave
us a single metric that we could set up
a monitor for by having a single value
like this that helps describe the mod
performance across multiple clients and
flagged activity we could easily set a
threshold to be used uh to determine
when to alert secure toads development
team that they need to retrain their
model so we built a python script to
capture this metric and prepared it to
be deployed as a custom model monitor
metric to deploy a custom model monitor
metric to AWS we developed a GitHub
actions workflow and pipeline to create
a Docker container image uh with that
script on it and upload it to AWS ECR
elastic container registry
repository uh to then be referenced by a
model monitor job when we need to make
one so this pipeline not only builds and
deploys New Image if the code to the
docker file or the custom metric script
in Python is modified um but this also
automates what would otherwise be a very
intensive manual process so we can now
easily build and deploy custom model
monitor scripts uh giving us the
flexibility with the metrics we can
return uh from the monitor so now that
we have the model monitor script ready
we need to factor it in to our
deployment
pipeline so we built out as part of the
ml training pipeline a step for
sagemaker model monitor creation
and automated cleanup for old endpoints
and resources so I'll guide us through
each step of the pipeline starting from
the left and explain their features and
what they do to add uh to the secure
toad product so we need continuous
monitoring and training of secure toads
algorithms to have it perform up to the
standard for their clients so in order
to facilitate that more seamlessly we
have a step function with all the
necessary components for training the
algorithm creating the model deploying
endpoints and monitoring them so the
first step here generates a unique
training job name based on their
requirements The Next Step creates a
stagemaker training job based off of the
name and secure Toad's custom
algorithm we send in hyperparameters at
the step as well so once the training
job has been completed a model version
is created and
stored then the endpoint configuration
is made which takes into consideration
the instance size we're deploying it on
the name of the endpoint and the data
capture configuration which is used by
the model
monitor once we have an endpoint
configuration the endpoint is deployed
and can now be inv invoked by uh their
production level site so once the
endpoint has been deployed a sagemaker
modle monitor job will be attached to it
uh via a Lambda function so this takes
the custom model monitor script that was
deployed to ECR uh via our Docker
Pipeline and schedules the script to run
every hour so the model monitor takes
data from the training data sets S3
bucket and some sample inference data
from production and generates metrics so
the monitoring job is set to only
execute if data has been sent through
the deployed
endpoint so when the model model monitor
generates a model report Json file it's
put into the model reports S3 bucket
that we made for them and an S3 event
and notification uh is sent to
sqsq uh for evaluation uh by a report
processing Lambda basically what this
Lambda does is that it looks at the
results of the report any kind of
significant violations uh the results of
the metrics and then determines what
action to take after that for example we
can conf have a configuration to send an
alert to the SNS topic to you send a
message to the development team to look
at deploying another model or running
more
experiments and then the final step of
the step function cleans up any old
endpoints and M monitors it looks at all
currently deployed endpoints and models
and deletes any endpoints and models
that are older uh than the last five
that were
deployed so now with a model monitor
secure toad can better ensure quality of
its application services to their
clients and that's the solution we
created for secur Toad and with that
I'll hand us over to Nathan or Stacy to
talk about our pocc funding
opportunity there happy to do that hi
everybody um and thank you guys so much
for walking us through that um hopefully
everybody had some great takeaways and
if you did and you're thinking about um
how do I get started and I may need to
Mo out this concept to my executive
stakeholders before I get before I get
full funding approval then AWS and metal
toad um have got uh some insights for
you here uh AWS offers proof of concept
funding uh if you partner with um an
aligned partner here like metal toad
then we can go in and um evaluate what
you guys are trying to prove out we can
then work with uh Amazon to understand
how this workload may impact your um
monthly Amazon uh web services costs and
and based on that you may have the
opportunity to um get up to 10% of oneye
annual reoccurring Revenue that uh will
be paid by Amazon to support this proof
of concept so uh it's a one-time cap out
um opportunity of up to
$25,000 uh and it it would be paid to
the partners such as metal tote at the
completion of the project so anyway if
this is something that's interesting to
you or you'd like to learn more about
how Amazon uh pocc funding could
potentially help you with a machine
learning initiative please reach out
we'd love to to see how we can get you
some free
[Music]
money thank you Stacy we are running
very low on time but let's see how many
questions we can get uh answered real
quick uh the first one we have here is
is are there any best practices or tips
for effectively using
sagemaker model monitor in real world
machine learning
projects uh praty can you answer that
one for us uh yes so I already talked
about um the instance uh utilization and
the S3 being in the same region Etc
other than that um this is not necessary
but as a best practice um some simple
things like keeping the variables in
lowercase and using underscore because
um all of this is going to go through uh
Sage sorry through Json and Par and um
uh sometimes spark because there are
spark jobs run U behind the scenes in
model monitor so uh it it kind of um
helps ease out the issues because of
special characters Etc so that's just
one more uh practice then typically Ally
model monitor is hosted in a VPC so
having all the accesses ready the VPC
endpoints available Etc all of those
needs to be taken care um as part of the
best practices and
tips thank you very much
yeah and we are at time if you want can
stick around we have a couple more we're
going to try to get to right now um but
if you can't thank you for joining us uh
next one how does stagemaker model
monitor capture and store the data
required for model for monitor Ing and
Analysis Ray can you grab that one yeah
I can grab that one uh so when you're
setting up a data capture configuration
you can Define on S3 uh upload path so a
particular bucket or URI basically a
destination you want the data to go to
when you're creating it and then you can
also set um a sampling percentage so you
can sample a specific percentage of the
data that is being fed through that
specific endpoint
and then that's sort of an S3 for you to
use for
evaluation
okay thank you and last one
here what do model monitor scripts look
like is it similar to writing a Lambda
function are there standard parameters
they expect Ray can you answer that one
as well yeah I can answer that one um
it's very simpler simple or similar to
running a normal python script like a
Jupiter notebook but essentially when
you create the model monitor you can set
up environmental variables to be passed
in uh that are accessible when the
script runs uh but it's it's it's very
similar to what you'd expect uh in a
Lambda
function great thank you very much those
are all of our questions I hope to see
you all here next time when we do our
next webinar
関連動画をさらに表示
AWS re:Invent 2020: Detect machine learning (ML) model drift in production
Sagemaker Model Monitor - Best Practices and gotchas
AWS DevDays 2020 - Deep Dive on Amazon SageMaker Debugger & Amazon SageMaker Model Monitor
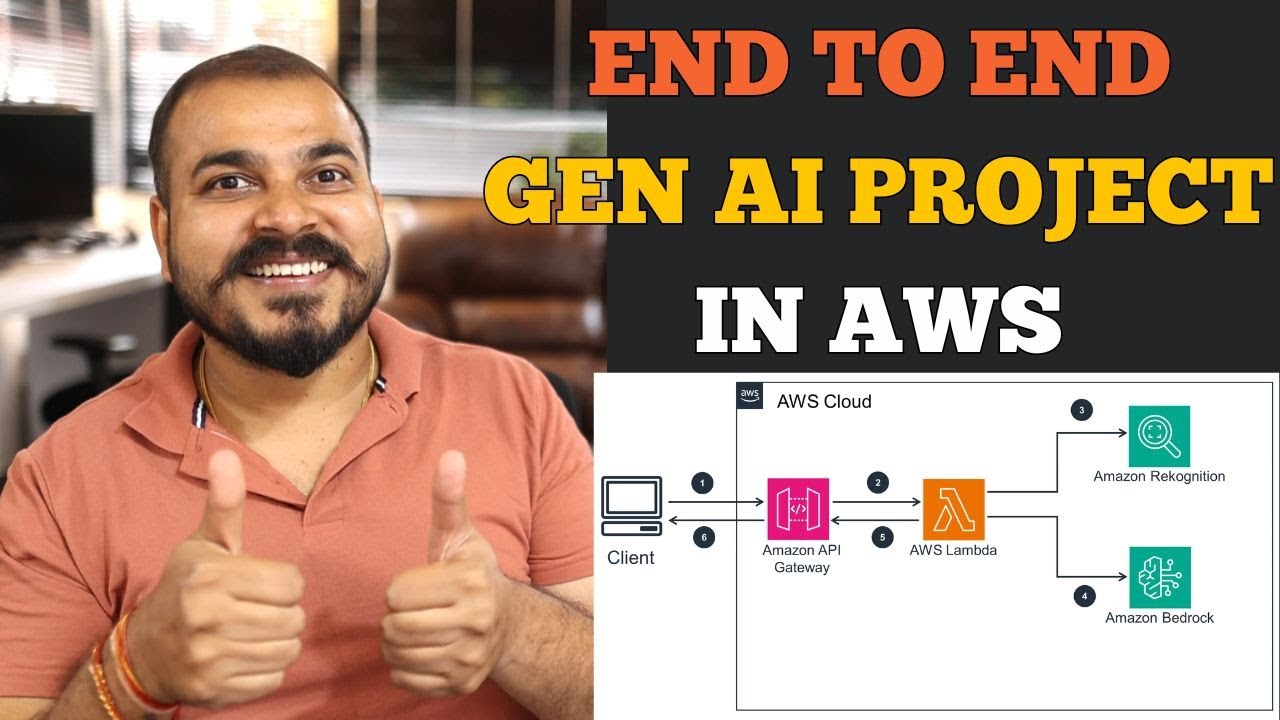
How to detect drift and resolve issues in you Machine Learning models?
Fine-tuning Tiny LLM on Your Data | Sentiment Analysis with TinyLlama and LoRA on a Single GPU
Online Machine Learning | Online Learning | Online Vs Offline Machine Learning
5.0 / 5 (0 votes)