Saya backtest Bollinger bands + RSI (Ini hasilnya)
Summary
TLDRIn this video, the presenter conducts a detailed manual backtest of trading indicators, focusing on Bollinger Bands and RSI, using Excel or Google Sheets with a starting capital of $5,000. Over 50 trades, they demonstrate the setup, risk management, and stop-loss strategies, revealing a 32% win rate and a net loss, emphasizing that using these indicators alone can lead to poor results. The video highlights the importance of incorporating trend indicators, such as EMA or price action, to improve profitability, offering practical advice for traders seeking more reliable, hands-on methods rather than relying solely on automated signals.
Takeaways
- 😀 The video demonstrates a 50-trade backtest using Bollinger Bands and RSI indicators on Excel or Google Sheets.
- 😀 Trading capital for the test is set at 5,000 units, with automatic calculation of wins, losses, and balance in the spreadsheet.
- 😀 Trades are entered manually to observe market behavior, rather than using automated robots.
- 😀 Risk/reward ratio is set at 2:1, with stop-loss and take-profit levels proportionally calculated.
- 😀 Stop-loss placement follows prior highs/lows: below previous low for buy trades, above previous high for sell trades.
- 😀 Bollinger Bands indicate overbought and oversold conditions, while RSI shows momentum and confirms trade signals.
- 😀 The combined use of Bollinger Bands and RSI alone produced a low win rate of 32% over 50 trades, resulting in a balance decrease from 5,000 to 4,800 units.
- 😀 Failures occur mainly due to ignoring the overall market trend; oscillators alone cannot reliably indicate profitable trades.
- 😀 Adding a trend indicator, such as EMA or price action analysis, is recommended to improve trade accuracy and win rate.
- 😀 Wider Bollinger Bands indicate higher volatility and provide better entry opportunities, improving trade probability.
- 😀 The video encourages viewers to subscribe, engage in comments, and participate in live trading sessions for additional guidance and feedback.
Q & A
What is the purpose of backtesting in trading?
-Backtesting allows traders to test a trading strategy using historical data to determine its potential effectiveness. In this case, the video focuses on testing a strategy using indicators like Bollinger Bands and RSI to evaluate win/loss ratios and overall performance.
What is the initial capital used for the backtest?
-The initial capital for the backtest is 5,000, and it automatically updates with each trade depending on whether the trade is a win or loss.
How does the backtesting spreadsheet work?
-The backtesting spreadsheet is designed to automatically update based on whether a trade is a win ('W') or a loss ('L'). The spreadsheet tracks profit and loss, adjusting the balance accordingly. Users can download or copy this sheet via the provided link.
What does 'W' and 'L' signify in the backtesting spreadsheet?
-'W' stands for a win, and 'L' stands for a loss. The spreadsheet uses these markers to automatically calculate the results of the trades.
What is the risk-to-reward ratio mentioned in the video?
-The risk-to-reward ratio in the video is set at 1:2. This means for every 100 points of risk (the stop loss), the reward (take profit) is set to 200 points.
How do you determine the stop loss and take profit levels in this strategy?
-The stop loss is placed above or below the high/low of the previous price action. The take profit is calculated using the 1:2 risk-to-reward ratio. For example, if the stop loss is 20 pips, the take profit would be 40 pips.
What are Bollinger Bands, and how are they used in this strategy?
-Bollinger Bands consist of a moving average with two standard deviation bands above and below it. They help identify overbought and oversold conditions in the market. In this strategy, traders look to sell when the price is near the upper band and buy when it's near the lower band.
How is the Relative Strength Index (RSI) used in this strategy?
-The RSI is used to measure the strength of price movements by comparing upward and downward price changes. In this strategy, an RSI above 70 indicates overbought conditions (potential sell), while an RSI below 30 indicates oversold conditions (potential buy).
Why does the trader suggest combining trend indicators with the Bollinger Bands and RSI?
-The trader suggests combining trend indicators (like EMA or price action) with Bollinger Bands and RSI to improve the accuracy of trades. Relying on only one set of indicators can result in false signals, especially if the market is trending strongly.
What were the results of the backtest, and what did the trader learn from it?
-The backtest showed a low win rate of 32%, with more losses than wins. The trader concluded that using only Bollinger Bands and RSI without considering the market trend is ineffective. The strategy led to a loss of capital, and the trader advised incorporating trend-following indicators to improve results.
Outlines

このセクションは有料ユーザー限定です。 アクセスするには、アップグレードをお願いします。
今すぐアップグレードMindmap

このセクションは有料ユーザー限定です。 アクセスするには、アップグレードをお願いします。
今すぐアップグレードKeywords

このセクションは有料ユーザー限定です。 アクセスするには、アップグレードをお願いします。
今すぐアップグレードHighlights

このセクションは有料ユーザー限定です。 アクセスするには、アップグレードをお願いします。
今すぐアップグレードTranscripts

このセクションは有料ユーザー限定です。 アクセスするには、アップグレードをお願いします。
今すぐアップグレード関連動画をさらに表示

Powerful swing or scalp strategy tuned for minimal drawdown and consistent results!
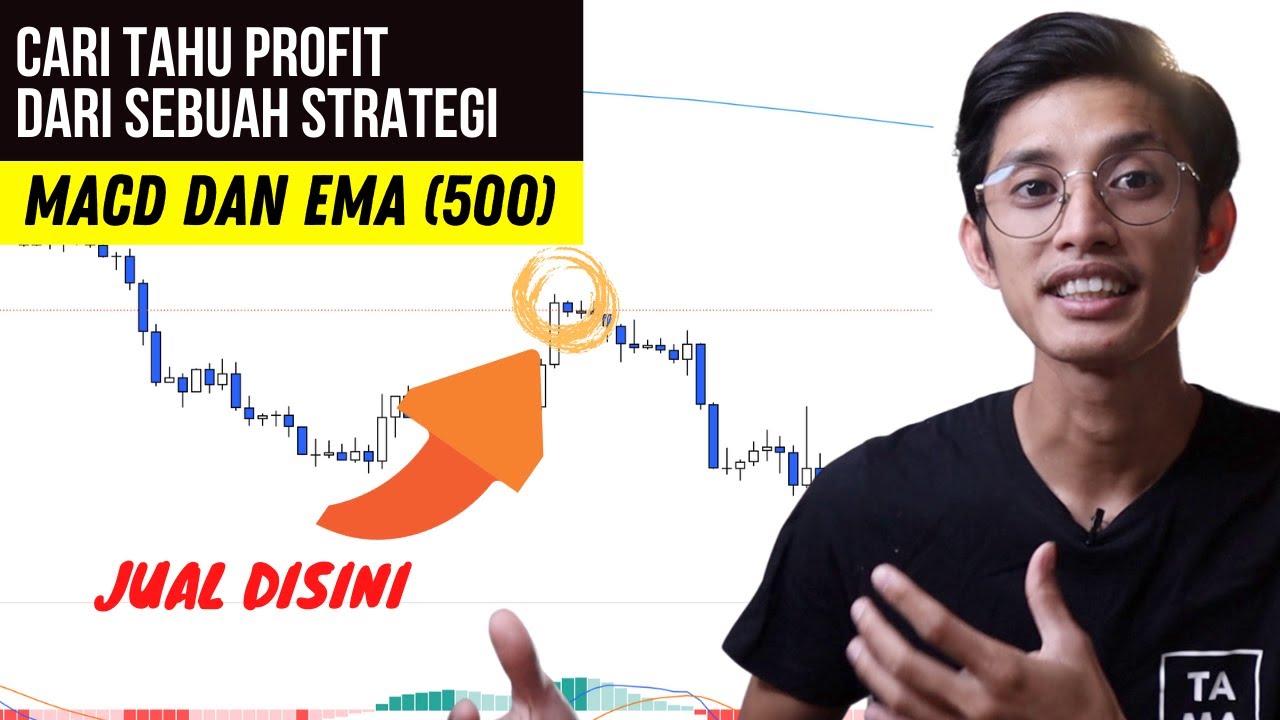
TEST SYSTEM TRADING MACD dan EMA (500) : Winrate bagus
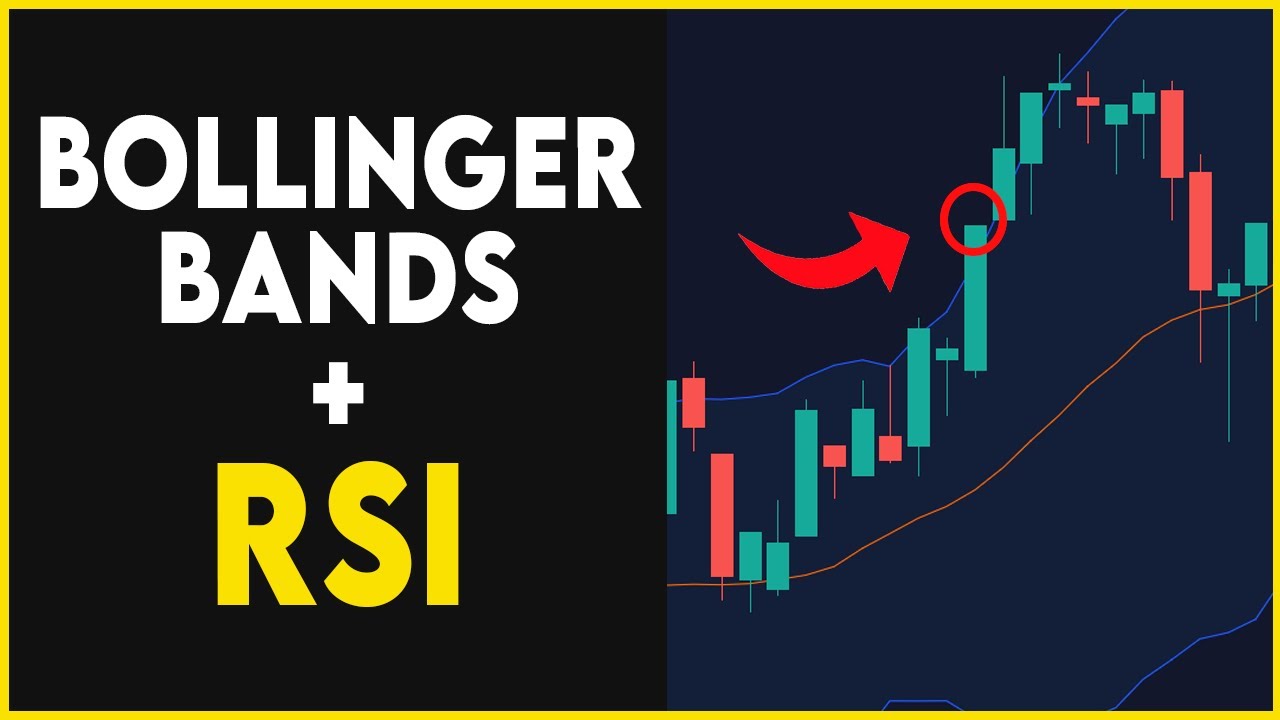
Bollinger Band + RSI Trading Strategy That Actually Works

Simple Method To Make $100 A Day Trading Cryptocurrency As A Beginner | Binance Tutorial Guide
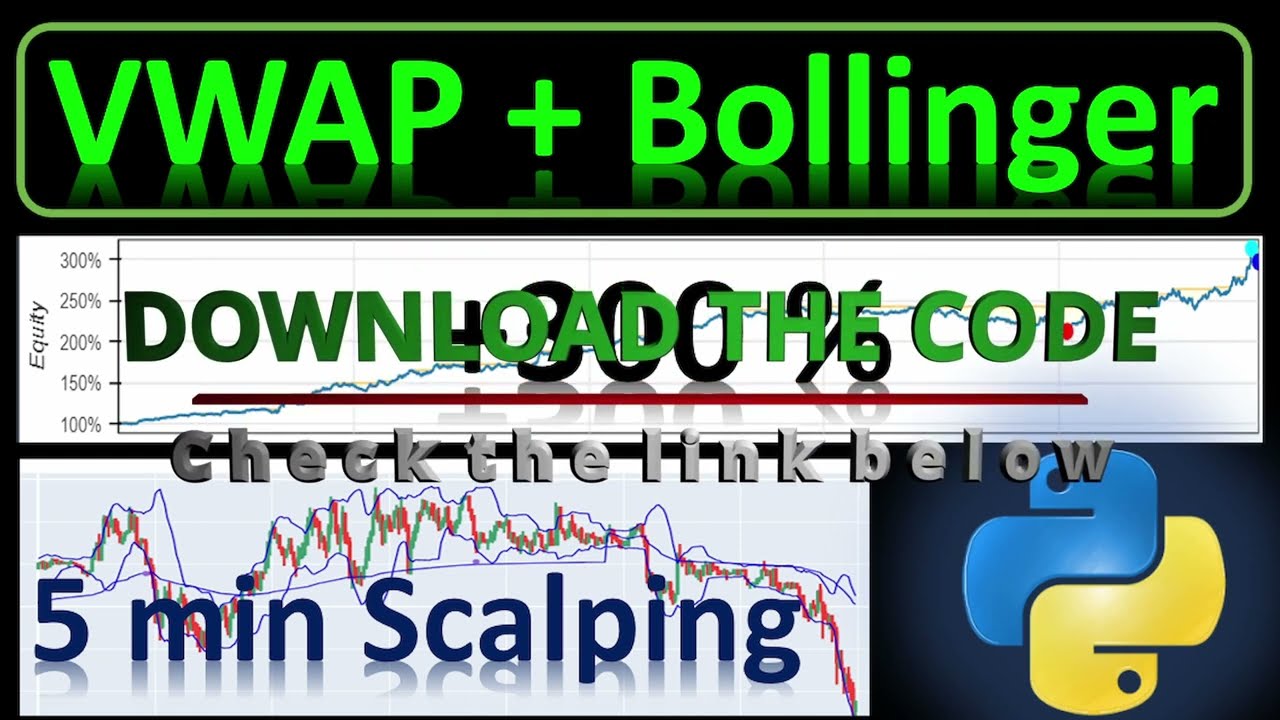
Python Backtest: Profitable Scalping Strategy with VWAP, Bollinger Bands and RSI Indicators
SAFEX BROKER - FAZENDO MAIS DE R$2.100 REAIS UTILIZANDO RSI E BDB
5.0 / 5 (0 votes)
