Saya backtest Parabolic SAR + EMA (Ini Winratenya)
Summary
TLDRIn this video, the host tests a trading system using the Parabolic SAR and EMA 200 indicators, with a risk-to-reward ratio of 1:2 and a 2% risk per trade. The system starts with a virtual $5,000 balance, and each trade is automatically calculated for win/loss outcomes. After 50 trades, the system shows a 42% win rate, with a profit of $1,300. The strategy involves analyzing market trends with Parabolic SAR and EMA 200, using simple buy and sell signals. The video highlights both the strengths and weaknesses of the system and invites viewers to share their opinions.
Takeaways
- 📊 The video demonstrates a backtest of a trading strategy using Parabolic SAR and EMA 200 over 50 trades.
- 💰 The initial capital is set at $5,000 with a fixed risk of 2% ($100) per trade.
- ⚖️ The strategy uses a risk-reward ratio of 1:2, meaning $100 loss vs $200 profit per trade.
- 📉 Stop loss is placed at the previous high/low, while take profit is set at twice the stop loss distance.
- 📈 EMA 200 is used to determine trend direction: buy above EMA, sell below EMA.
- 🔄 Parabolic SAR is used as an entry signal to identify potential trend reversals.
- 🚫 Only one trade is allowed at a time to avoid excessive losses from multiple open positions.
- 📉 The backtest results show 21 wins and 29 losses, resulting in a 42% win rate.
- 💵 Despite a low win rate, the account grew from $5,000 to $6,300, yielding a $1,300 profit.
- ⚠️ The strategy generates frequent entry signals, which can be risky if overtrading occurs.
- 📊 The system experienced a losing streak of up to 7 trades and a winning streak of up to 4 trades.
- 📈 The equity curve showed relatively stable growth despite multiple losses.
- 🧠 Strong risk management and discipline are key factors in making this strategy profitable.
- 🤔 The creator does not personally recommend the strategy outright and invites viewers to evaluate it themselves.
- 💬 Viewers are encouraged to suggest other strategies for future backtesting.
Q & A
What is the main purpose of the video series 'Back Test 50'?
-The main purpose of 'Back Test 50' is to test and evaluate the win rate of different trading systems using indicators like Parabolic SAR and EMA 200, helping traders make informed decisions without risking real money.
What indicators are used in this backtesting episode?
-This episode uses the Parabolic SAR (Stop and Reverse) and the 200-period Exponential Moving Average (EMA 200) to identify trend direction and potential entry points.
How is the initial trading capital simulated in the backtest?
-The initial capital is simulated as $5,000 using a Google Sheet-based testing tool that automatically calculates wins, losses, and the balance based on set risk and reward rules.
What risk and reward ratio is used in this strategy?
-The strategy uses a 1:2 risk-to-reward ratio, risking $100 per trade to potentially gain $200 per winning trade.
How is stop loss determined in this strategy?
-Stop loss is set based on the previous high or low depending on whether the trade is a sell or buy, ensuring it adapts to market volatility.
How does the video suggest determining buy and sell opportunities?
-Trading signals are determined by the position relative to the EMA 200 and confirmation from the Parabolic SAR. Trades are only taken when both indicators align for a buy or sell.
What timeframe and currency pair are used in this backtest?
-The backtest uses the 1-hour (H1) timeframe for the EUR/USD currency pair.
What were the results of 50 trades in this episode?
-Out of 50 trades, there were 21 wins and 29 losses, resulting in a win percentage of 42%. The simulated capital increased from $5,000 to $6,300.
What is a key limitation of this strategy mentioned in the video?
-A major limitation is the high number of potential entries, which can lead to multiple losing trades if more than one trade is opened at the same time. The video recommends limiting to a single open trade at a time.
Why does the video emphasize testing a system before using real money?
-Testing a system beforehand helps traders understand its win rate, risk, and performance without risking actual funds, ultimately preventing unnecessary financial losses.
Outlines

このセクションは有料ユーザー限定です。 アクセスするには、アップグレードをお願いします。
今すぐアップグレードMindmap

このセクションは有料ユーザー限定です。 アクセスするには、アップグレードをお願いします。
今すぐアップグレードKeywords

このセクションは有料ユーザー限定です。 アクセスするには、アップグレードをお願いします。
今すぐアップグレードHighlights

このセクションは有料ユーザー限定です。 アクセスするには、アップグレードをお願いします。
今すぐアップグレードTranscripts

このセクションは有料ユーザー限定です。 アクセスするには、アップグレードをお願いします。
今すぐアップグレード関連動画をさらに表示
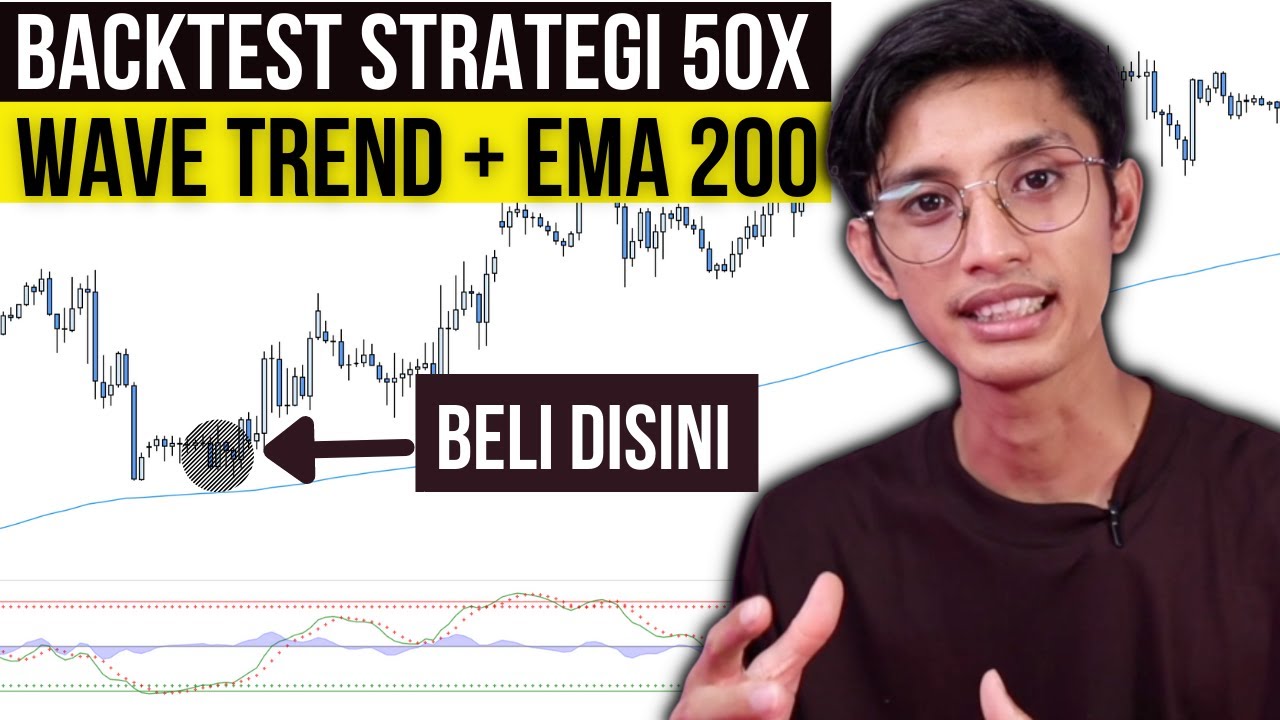
Backtest WAVE TREND dan EMA 200 : Hasilnya mengejutkan
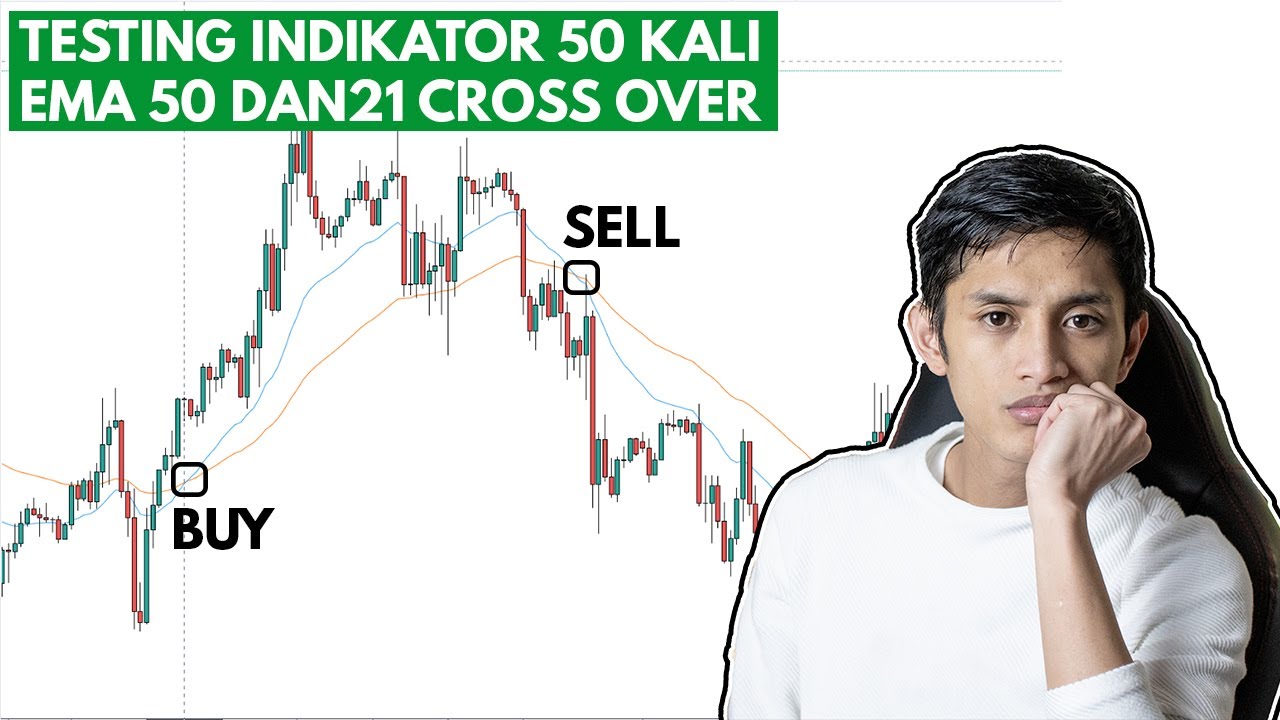
Testing indikator 50 kali Vol 4 - Crossover EMA 50 dan 21

Back Testing 50 kali Vol 5 - Cross over EMA 50 dan EMA 100

O SISTEMA QUE MAIS VAI TE DAR DINHEIRO!
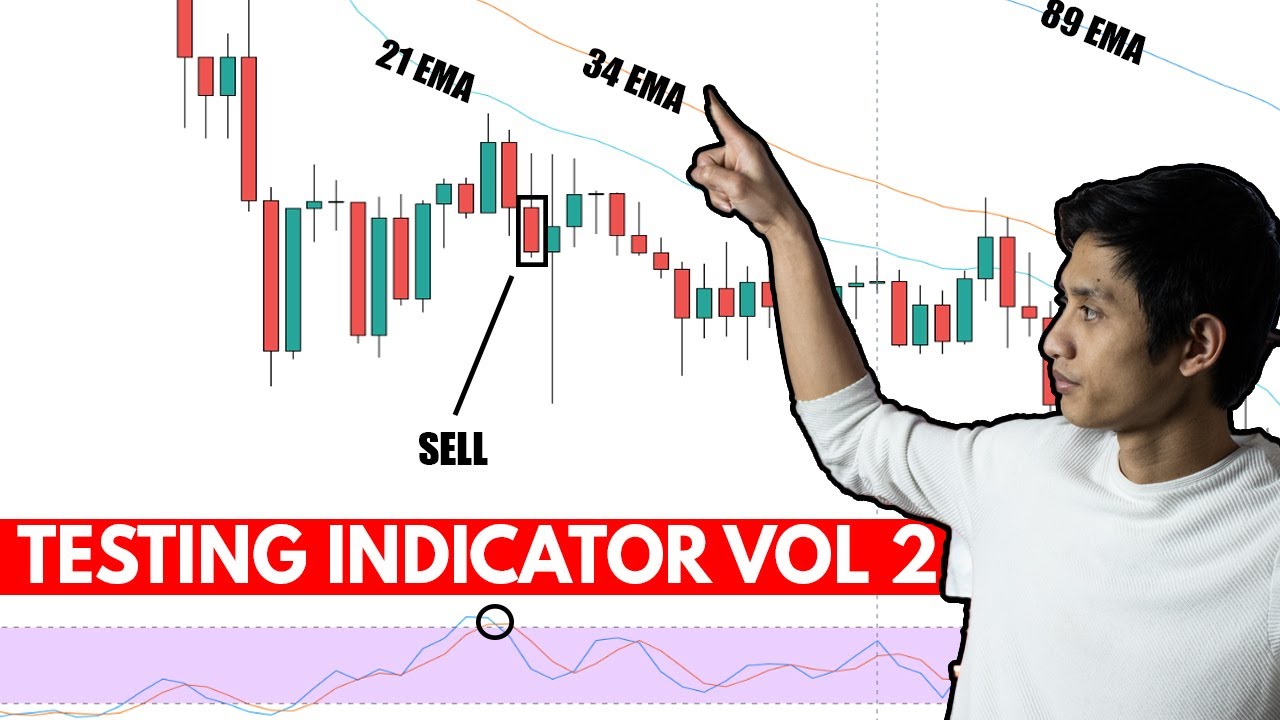
Testing 50 kali indikator Vol 2 - EMA (21,34,89) dan Stochastic
BEST 5 Minute Crypto Scalping Strategy (Simple)
5.0 / 5 (0 votes)
