Simple Linear Regression: An Easy and Clear Beginner’s Guide
Summary
TLDRThis video introduces simple linear regression, explaining how it helps predict a dependent variable, such as house price, based on an independent variable like house size. It covers the calculation of regression coefficients (slope and intercept) and how they are derived from data. The video also discusses the assumptions required for a reliable regression model, including linearity, independence of errors, homoscedasticity, and normality. Using both manual calculations and software tools like DataTab, the video provides a clear example of how to apply regression analysis to real-world data.
Takeaways
- 😀 Simple linear regression is a method to understand the relationship between two variables and predict one based on the other, like predicting house prices based on house size.
- 😀 The dependent variable is the one you want to predict, while the independent variable is used to make the prediction.
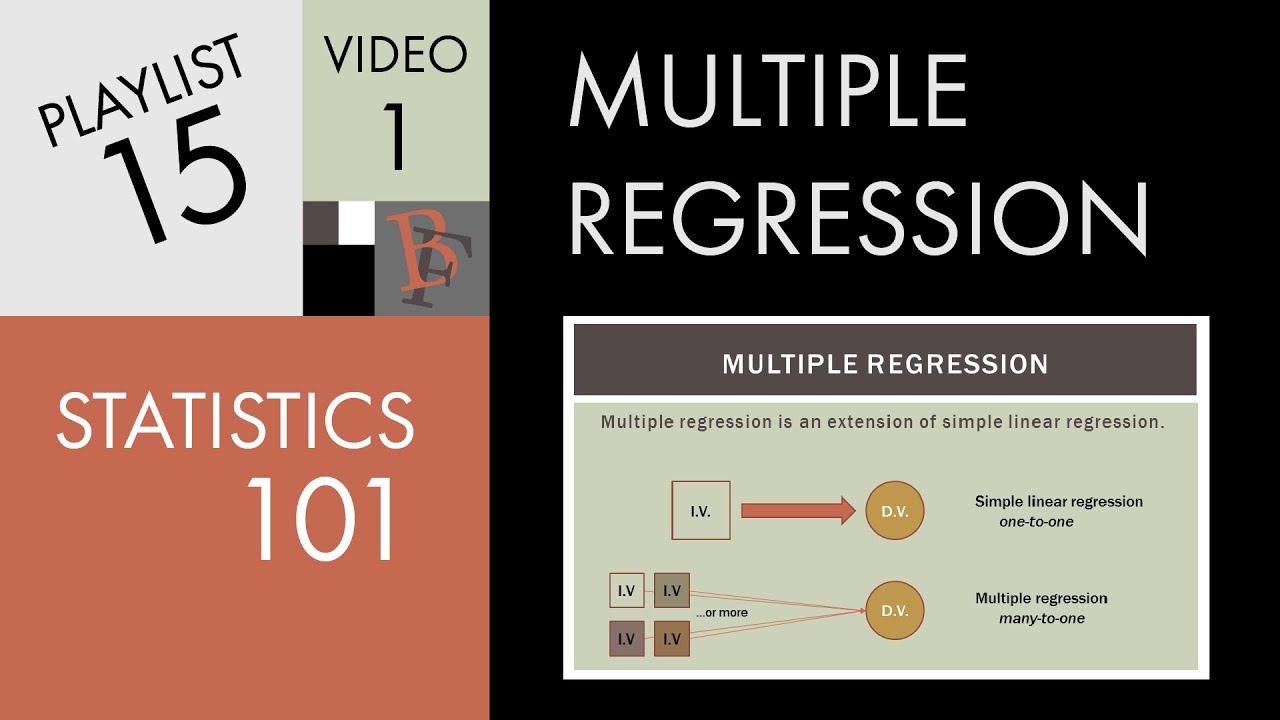
- 😀 In multiple linear regression, you can use more than one independent variable, like house size, number of bathrooms, or whether a house has a swimming pool.
- 😀 A scatter plot helps visualize the relationship between variables, with the independent variable on the x-axis and the dependent variable on the y-axis.
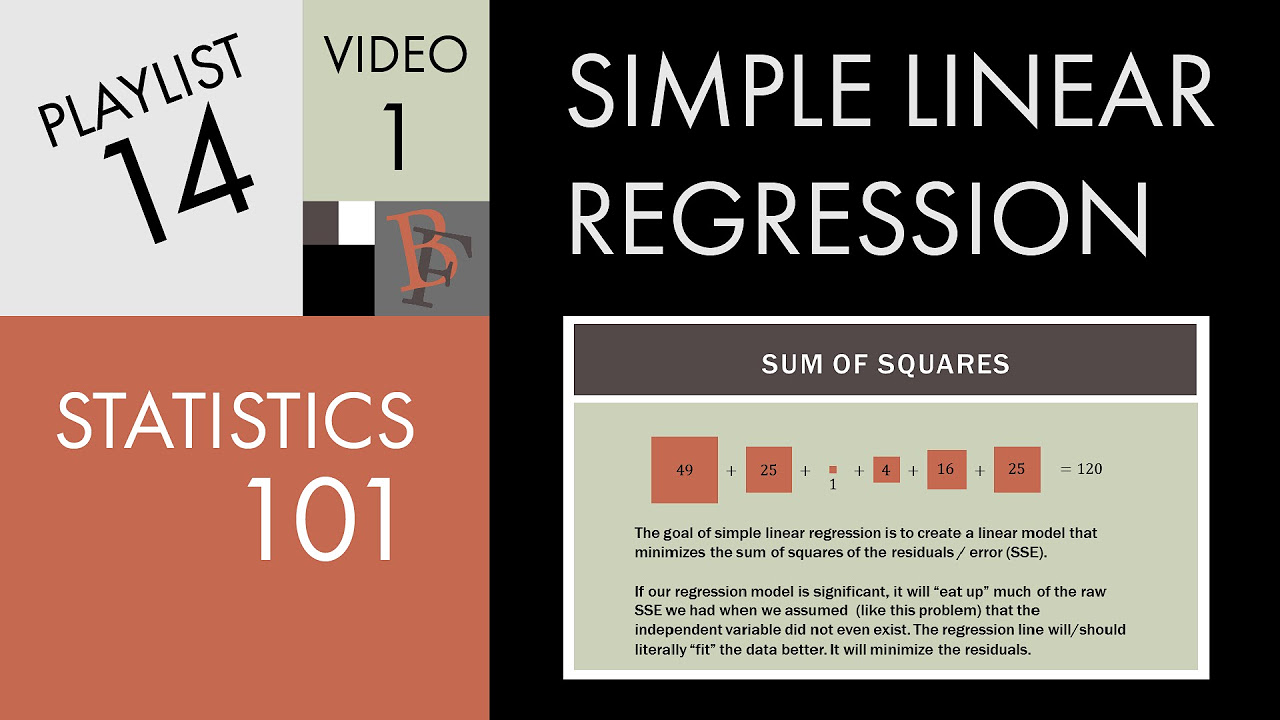
- 😀 The goal of simple linear regression is to find the regression line that minimizes the error (distance between data points and the line).
- 😀 The equation of the regression line has two key parameters: the slope (B) and the intercept (A). The slope shows how much the dependent variable changes when the independent variable increases by one unit.
- 😀 The intercept (A) represents the predicted value of the dependent variable when the independent variable is zero, even if this doesn't always make practical sense.
- 😀 To calculate the slope (B), you can use the formula involving the correlation coefficient and standard deviations of both variables. Statistical software simplifies this process.
- 😀 Once you have the slope (B), you can calculate the intercept (A) using the mean values of the dependent and independent variables.
- 😀 The P-value in regression analysis helps assess whether the relationship between the independent and dependent variables is statistically significant. A P-value less than 0.05 typically indicates a significant relationship.
- 😀 The key assumptions of simple linear regression include linearity, independence of errors, homoscedasticity (equal variance of errors), and normally distributed errors. Violating these assumptions can affect the reliability of the results.
Q & A
What is simple linear regression?
-Simple linear regression is a statistical method used to understand the relationship between two variables, allowing one to predict a dependent variable based on the value of an independent variable.
What is the difference between a dependent and an independent variable?
-The dependent variable is the one we want to predict, while the independent variable is the one used for prediction. For example, in predicting house prices, the price is the dependent variable and the house size is the independent variable.
What makes a regression model 'multiple' rather than 'simple'?
-A regression model is considered multiple when it uses more than one independent variable to predict the dependent variable. Simple regression uses only one independent variable.
How is a regression line determined in simple linear regression?
-A regression line is determined by finding the line that minimizes the total distance (error) between the actual data points and the line itself, typically using the least squares method.
What do the slope and intercept represent in a regression equation?
-In the equation Y = a + bX, the slope (b) represents the change in the dependent variable for a one-unit increase in the independent variable, while the intercept (a) represents the predicted value of the dependent variable when the independent variable is zero.
How can the slope (b) and intercept (a) be calculated?
-The slope (b) can be calculated using the formula b = r × (Sy / Sx), where r is the correlation coefficient and Sy and Sx are the standard deviations of Y and X, respectively. The intercept (a) is calculated as a = Ȳ - bX̄, where Ȳ and X̄ are the means of Y and X.
What does a P-value indicate in regression analysis?
-The P-value indicates whether the relationship between the independent and dependent variables is statistically significant. A P-value less than 0.05 suggests a significant relationship, while a P-value greater than 0.05 suggests the relationship may be due to chance.
What are the key assumptions of simple linear regression?
-The key assumptions are: 1) Linear relationship between variables, 2) Independence of errors, 3) Homoscedasticity (constant variance of errors), and 4) Normally distributed errors.
How can we check if the assumptions of linear regression are met?
-Linear relationship can be checked using a scatter plot, normality of errors with a QQ plot or analytical tests, independence of errors with the Durbin-Watson test, and homoscedasticity with a residual plot.
Why is it important to check regression assumptions?
-Checking assumptions ensures that the regression results are reliable and meaningful. Violations of assumptions can lead to inaccurate predictions and misleading conclusions.
What is the practical interpretation of a regression model with an intercept and slope?
-The intercept represents the predicted value of the dependent variable when the independent variable is zero, while the slope quantifies how much the dependent variable changes for each unit increase in the independent variable. For example, if the slope is 18.35 for house size, each additional square foot increases the predicted house price by $18.35.
Outlines

このセクションは有料ユーザー限定です。 アクセスするには、アップグレードをお願いします。
今すぐアップグレードMindmap

このセクションは有料ユーザー限定です。 アクセスするには、アップグレードをお願いします。
今すぐアップグレードKeywords

このセクションは有料ユーザー限定です。 アクセスするには、アップグレードをお願いします。
今すぐアップグレードHighlights

このセクションは有料ユーザー限定です。 アクセスするには、アップグレードをお願いします。
今すぐアップグレードTranscripts

このセクションは有料ユーザー限定です。 アクセスするには、アップグレードをお願いします。
今すぐアップグレード関連動画をさらに表示
Statistics 101: Multiple Linear Regression, The Very Basics 📈
[Mathematics in the Modern World] Correlation & Simple Linear Regression

PERBEDAAN REGRESI LINEAR SEDERHANA DAN REGRESI BERGANDA
Statistics 101: Linear Regression, The Very Basics 📈

Regresi dan Korelasi Sederhana

Regression and R-Squared (2.2)
5.0 / 5 (0 votes)
