Is This A Concerning Sign? - TSLA Stock, SPY, QQQ Update
Summary
TLDRIn this Tesla update, the host analyzes the stock’s recent performance, noting a 1.25% decline to $346.50 despite broader market gains. He highlights short-term complications, including a bearish engulfing candle and critical support around $344, while maintaining an overall bullish outlook based on MACD, EMAs, and a rising triangle pattern. Potential breakout targets include $365, $380s, and possibly $400 if key levels hold. The broader market shows bullish control but with divergences signaling possible sideways movement. Options flow indicates put activity impacting intraday momentum. The video emphasizes monitoring key support levels to gauge Tesla’s short-term and mid-term trajectory.
Takeaways
- 📉 Tesla closed down 1.25% at around $346.50 despite the broader market moving higher.
- 🔑 The $350 level is a critical support for Tesla; holding above it maintains bullish potential.
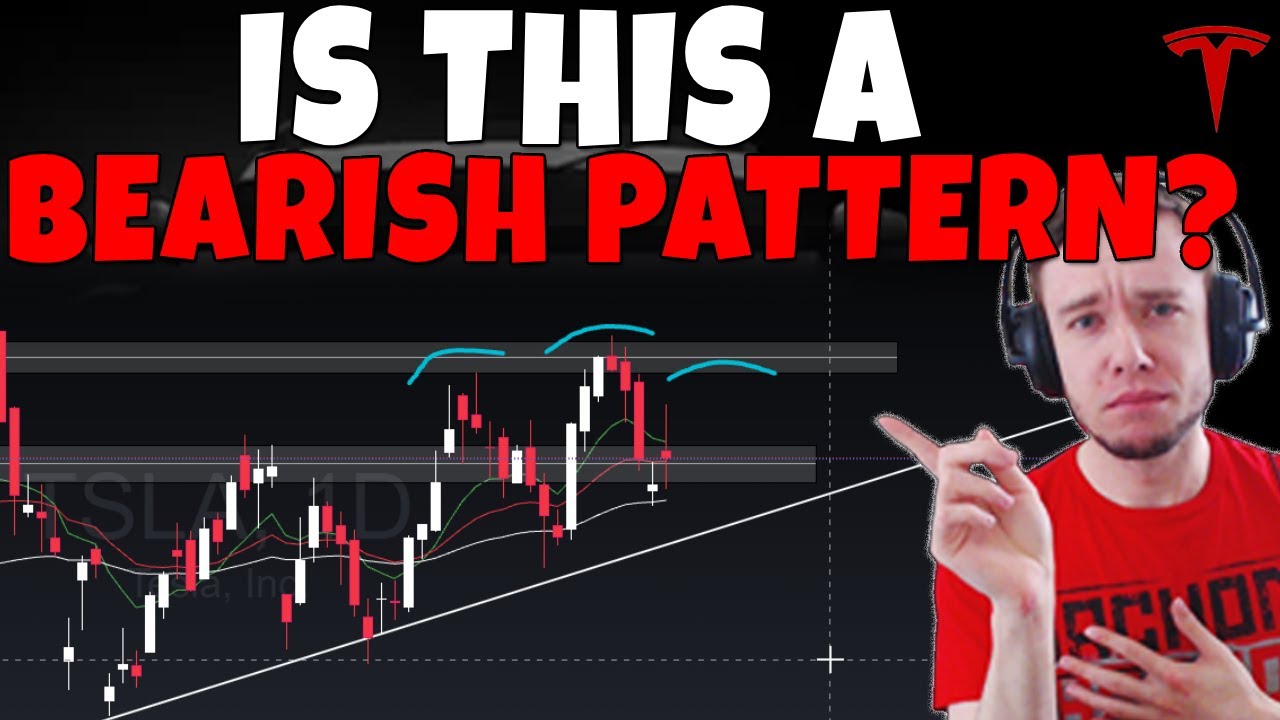
- ⚠️ A bearish engulfing candle was printed, signaling a potential short-term reversal if confirmed by a close below today's low (~$344).
- 📊 The ideal scenario for bulls is holding today's low and avoiding filling the gap, which would indicate stronger bullish momentum.
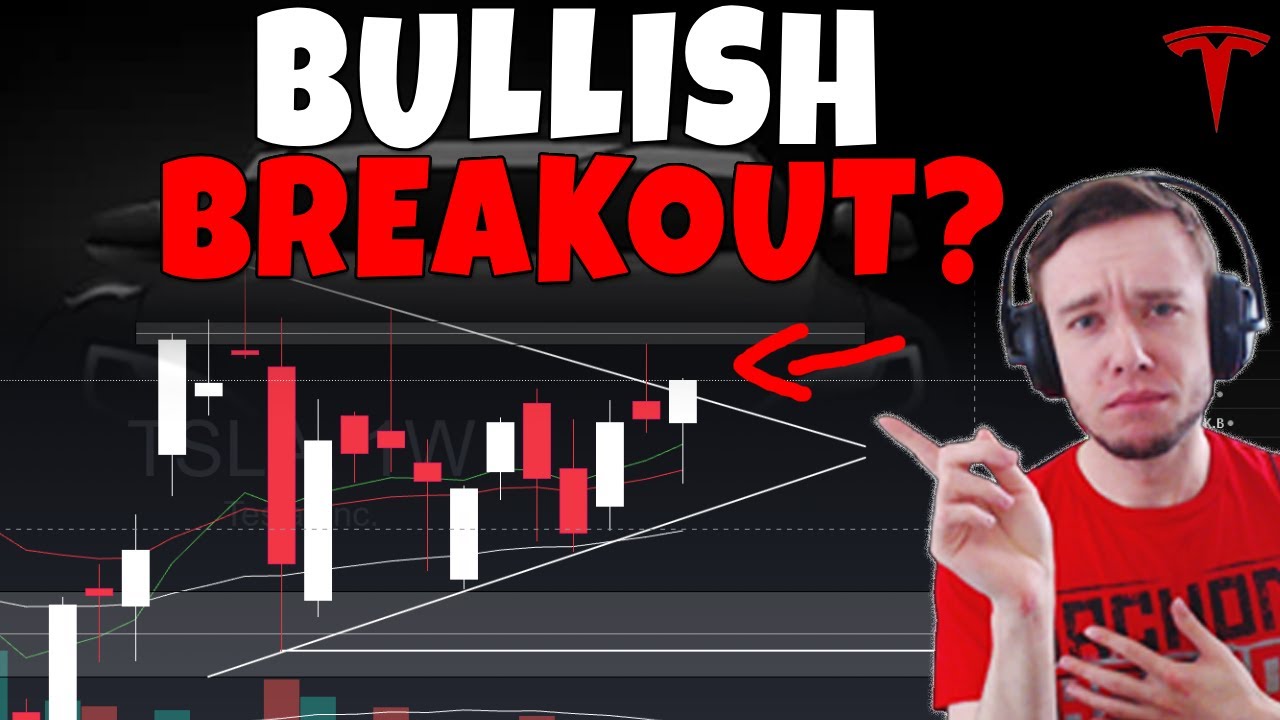
- 📈 Tesla is in a rising triangle pattern with bullish MACD, EMAs, and supertrend indicators, supporting medium-term bullishness.
- 🚨 Short-term price targets if bullish momentum holds: $365 first, then $380, with potential to reach $400+.
- 💹 Broader market (Q’s and SPY) shows bearish divergence on MACD and RSI, suggesting possible sideways movement or minor corrections.
- 🛑 Key market levels to watch: Q’s above mid-570s for bullish control; below 560 may trigger deeper corrections.
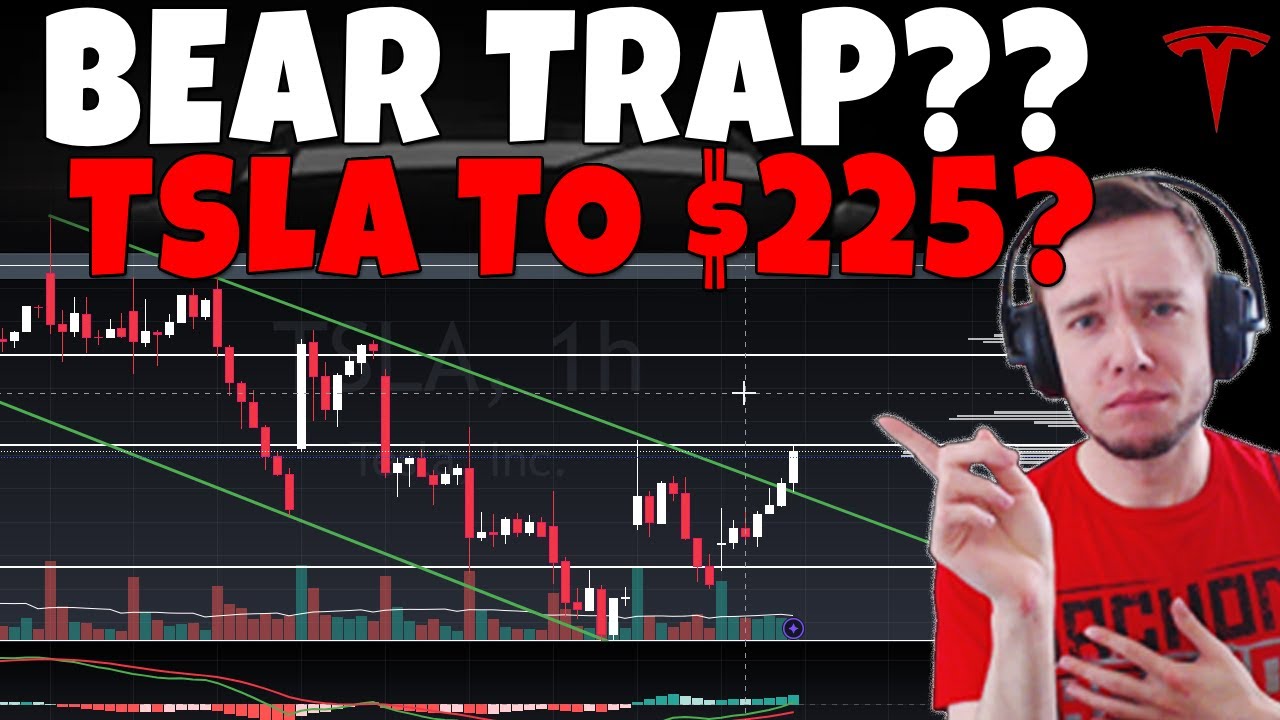
- 💼 Options flow indicated significant short-term put buying on Tesla around $352, causing intraday reversals.
- 📌 Overall, Tesla remains bullish on the medium-term, but short-term caution is advised until support levels hold and confirmations occur.
- 📅 Events like CPI on Thursday are important catalysts that could influence short-term market and Tesla price action.
- 📌 Holding the September 2 low (~$326) is crucial for maintaining the overall bullish trend for Tesla over the coming weeks.
Q & A
What was Tesla's closing price in the video, and how did it compare to the broader market?
-Tesla closed down approximately 1.25% at $346.50, while the broader market went up, highlighting that Tesla often moves independently from general market trends.
What short-term support levels should Tesla bulls watch according to the video?
-Short-term support levels to watch are around $345, with today's low (~$344) being a critical level. Losing this support could indicate bearish momentum.
What is the significance of the bearish engulfing candle mentioned in the video?
-The bearish engulfing candle is a strong reversal pattern. Its relevance depends on whether Tesla closes below today's low (~$344), which would confirm short-term bearish risk.
What are the potential upside targets for Tesla if it maintains support?
-If Tesla maintains support above the low 350s, the potential upside targets are $365, then $380s, and potentially reaching $400 if bullish momentum continues.
What medium-term indicators suggest that Tesla remains bullish?
-Tesla’s MACD, EMAs, supertrend, and the rising triangle pattern all suggest a medium-term bullish bias as long as the trendline around $326 holds.
How did Tesla respond to short-term options activity mentioned in the video?
-Short-term put buying in Tesla was observed, which coincided with an intraday reversal, indicating active market sentiment and hedging around $352.
What key levels should traders watch in QQQ to assess market health?
-Traders should watch mid-570s as support for bullish control. Falling below 560 could trigger a retest of previous market lows and signal broader market weakness.
What do the divergences in MACD and RSI indicate about the broader market?
-Bearish divergences in MACD and RSI suggest that while the market is rising, momentum is weakening, which could lead to sideways or choppy trading rather than immediate declines.
How does the video explain the reliability of bullish patterns?
-The video explains that bullish patterns, like rising triangles or bull flags, indicate higher probability of upward moves but do not guarantee a bullish outcome; confirmation from price action is required.
What is the impact of CPI data on Tesla’s short-term trend according to the video?
-CPI data, scheduled for Thursday, could influence short-term momentum. Breaking below key support around $344 before or after CPI could trigger bearish sentiment.
What does the video suggest about Tesla’s movement relative to its own bubble versus the broader market?
-Tesla often moves in its own bubble and does not always follow the broader market. Even when the market is at all-time highs, Tesla can remain below previous highs and behave independently.
Why is it important for Tesla not to fill the gap mentioned in the video?
-Filling the gap would imply weakening bullish momentum. Maintaining above the gap strengthens the bullish move and confirms that buyers are still in control.
Outlines

このセクションは有料ユーザー限定です。 アクセスするには、アップグレードをお願いします。
今すぐアップグレードMindmap

このセクションは有料ユーザー限定です。 アクセスするには、アップグレードをお願いします。
今すぐアップグレードKeywords

このセクションは有料ユーザー限定です。 アクセスするには、アップグレードをお願いします。
今すぐアップグレードHighlights

このセクションは有料ユーザー限定です。 アクセスするには、アップグレードをお願いします。
今すぐアップグレードTranscripts

このセクションは有料ユーザー限定です。 アクセスするには、アップグレードをお願いします。
今すぐアップグレード


5.0 / 5 (0 votes)
