The EASIEST ICT Market Structure Trading Strategy (FULL COURSE)
Summary
TLDRThis video provides in-depth trading insights, focusing on market structure and smart money principles. The speaker explains how to spot trends in both bearish and bullish markets, emphasizing key strategies like selling above highs in bearish markets and buying below lows in bullish markets. The importance of using specific time frames and tools, such as Fibonacci for identifying premium and discount zones, is also discussed. Additionally, the video stresses the importance of implementation and offers mentorship to help traders refine their skills and become profitable, with a focus on live trading experience.
Takeaways
- 😀 Understanding market structure is key to recognizing when to trade and when to stay out.
- 📉 In bearish markets, sell above previous highs, as this is where smart money exits their positions.
- 📈 In bullish markets, buy below previous lows, as the market is likely to reverse to the upside.
- 🧠 A deep understanding of market structure helps prevent fear-driven decisions and enables consistent trading strategies.
- 🔄 Market structure shifts signal important changes in trend direction, and identifying them early provides trading opportunities.
- ⏱ Choose a specific time frame set that suits your trading style to avoid confusion and analysis paralysis.
- 📊 Use the Fibonacci tool on trading platforms to identify premium (for selling) and discount (for buying) zones.
- 🔍 Avoid overcomplicating your strategy with too many time frames. Focus on one set based on your trading goals.
- ⚠️ Market reversals can often be identified when price fails to displace at a higher time frame key level.
- 🎯 Implementing the right strategy consistently will help you develop a clear edge in the market, improving your results over time.
- 💡 True learning happens when you implement knowledge and change your trading behavior—not just from passive consumption of information.
Q & A
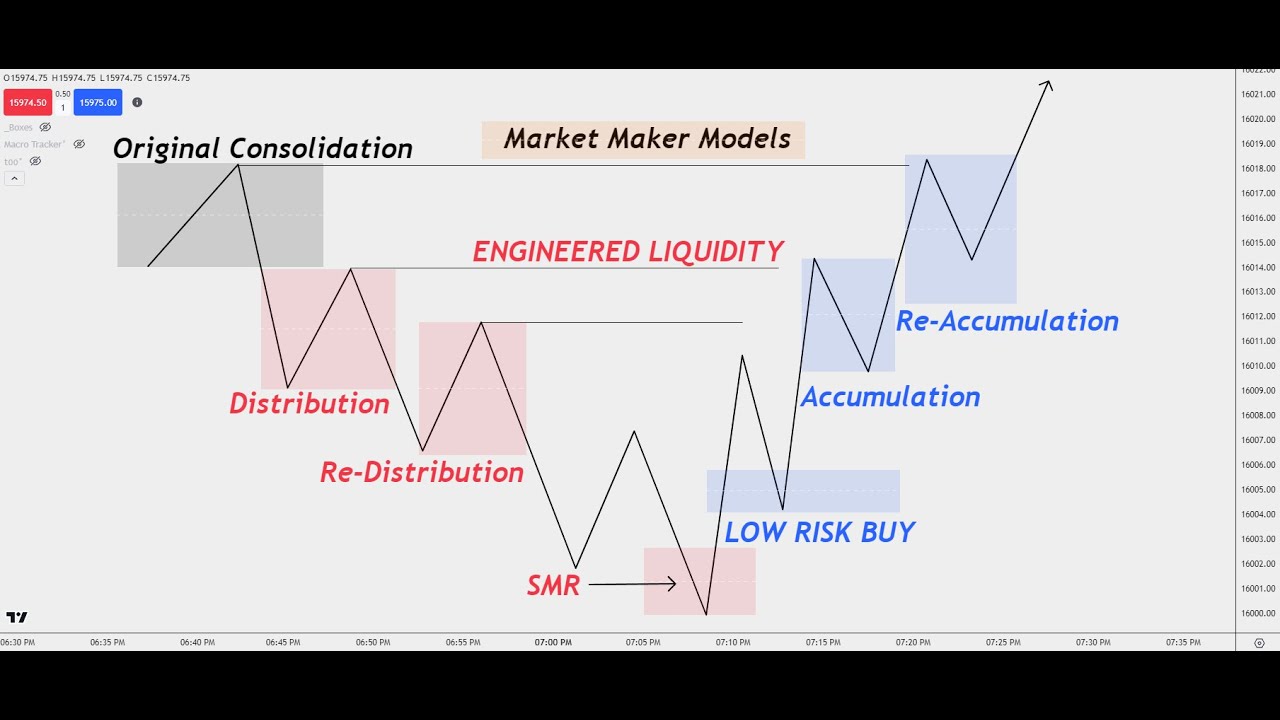
What is the core principle behind the Market Maker model in trading?
-The core principle behind the Market Maker model is understanding market structure to identify when to enter or exit trades. In a bearish market, you sell above highs, and in a bullish market, you buy below lows. This strategy helps traders avoid common pitfalls and trade with confidence.
How do you determine whether the market is bearish or bullish?
-The market is determined to be bearish when there is a consistent downward movement in price, typically confirmed by a bearish market structure shift. Conversely, a bullish market shows an upward trend and structure, with higher highs and higher lows.
What is the significance of selling above highs in a bearish market?
-Selling above highs in a bearish market aligns with the actions of 'smart money' or institutional traders. Since the market is trending downwards, price actions above previous highs often serve as liquidity runs before the market continues downward.
How can understanding market structure help you avoid panic during trade reversals?
-By understanding market structure and recognizing the signs of a shift, traders can stay calm when price moves unexpectedly. Instead of panicking, they can anticipate the reversal or continuation of a trend, allowing them to stay consistent with their strategy.
Why is it important to focus on a limited set of time frames for trading?
-Focusing on a limited set of time frames helps traders avoid confusion and overwhelming analysis. By choosing a time frame that aligns with their trading style, whether for short-term or swing trading, they can more effectively interpret market signals and make decisions.
What role does the Fibonacci tool play in identifying premium and discount zones?
-The Fibonacci tool helps traders identify the premium and discount zones on a price chart. The 0.5 level typically represents the midpoint, with the premium area being above this level (where you look to sell) and the discount area below it (where you look to buy).
What is the difference between using higher and lower time frames for market analysis?
-Higher time frames provide a broader view of the market trend, helping you identify key levels and overall direction. Lower time frames offer more specific details for entering and exiting trades. Using both helps traders align their short-term decisions with the longer-term trend.
How can you spot when a strategy is likely to fail or reverse?
-A strategy may fail or reverse when a key market level is reached, but there is a lack of displacement or significant movement. If the price fails to break through or move beyond these levels, it could signal a reversal or a shift in market sentiment.
What does it mean to trade with an edge, and how do you develop it?
-Trading with an edge means having a strategy or advantage that consistently improves the probability of success in the markets. You develop it by understanding market structure, identifying trends, and executing your trades based on solid, tested strategies—like those presented in the Market Maker model.
Why is implementation crucial in the learning process for traders?
-Implementation is crucial because simply consuming educational content does not lead to true learning. To truly learn, a trader must execute their knowledge in live markets, adapting and refining their strategies based on real-world experience. Without implementation, progress is limited.
Outlines

このセクションは有料ユーザー限定です。 アクセスするには、アップグレードをお願いします。
今すぐアップグレードMindmap

このセクションは有料ユーザー限定です。 アクセスするには、アップグレードをお願いします。
今すぐアップグレードKeywords

このセクションは有料ユーザー限定です。 アクセスするには、アップグレードをお願いします。
今すぐアップグレードHighlights

このセクションは有料ユーザー限定です。 アクセスするには、アップグレードをお願いします。
今すぐアップグレードTranscripts

このセクションは有料ユーザー限定です。 アクセスするには、アップグレードをお願いします。
今すぐアップグレード関連動画をさらに表示

ICT Market Maker Model - Explained In-depth!

3 High Probability Scalping Strategies Using Smart Money Concepts
ICT Concepts: Understanding How To Trade ICT Market Maker Models!

Identifying Key Structures & Liquidity Zones

ICT SMT Divergence - Everything to Know About (Secrets)

How To Identify Liquidity in Trading (SMC Trading)
5.0 / 5 (0 votes)
