TESLA Stock - Crucial Levels On TSLA Here
Summary
TLDRIn this Tesla update video, the creator provides insights into the current state of Tesla's stock and the broader market. They discuss the technical analysis, focusing on the $375 price target for Tesla, potential warning signs like bearish divergences and critical support levels at $350. The video emphasizes the importance of monitoring key factors like the nine exponential moving average and the rising channel. They also explore a potential cup and handle pattern that could signal a bullish breakout, but caution that it might take several months. The creator wraps up with observations on options flow and ongoing market conditions.
Takeaways
- 😀 Tesla's stock remains flat for the day, closing at 43%, with a slight pullback after a gap up due to robo-taxi news.
- 😀 The speaker's target price for Tesla is $375 per share, although the stock may experience fluctuations before reaching this level.
- 😀 The 9 exponential moving average (EMA) is a critical indicator, with the speaker emphasizing that losing it could signal a bearish trend.
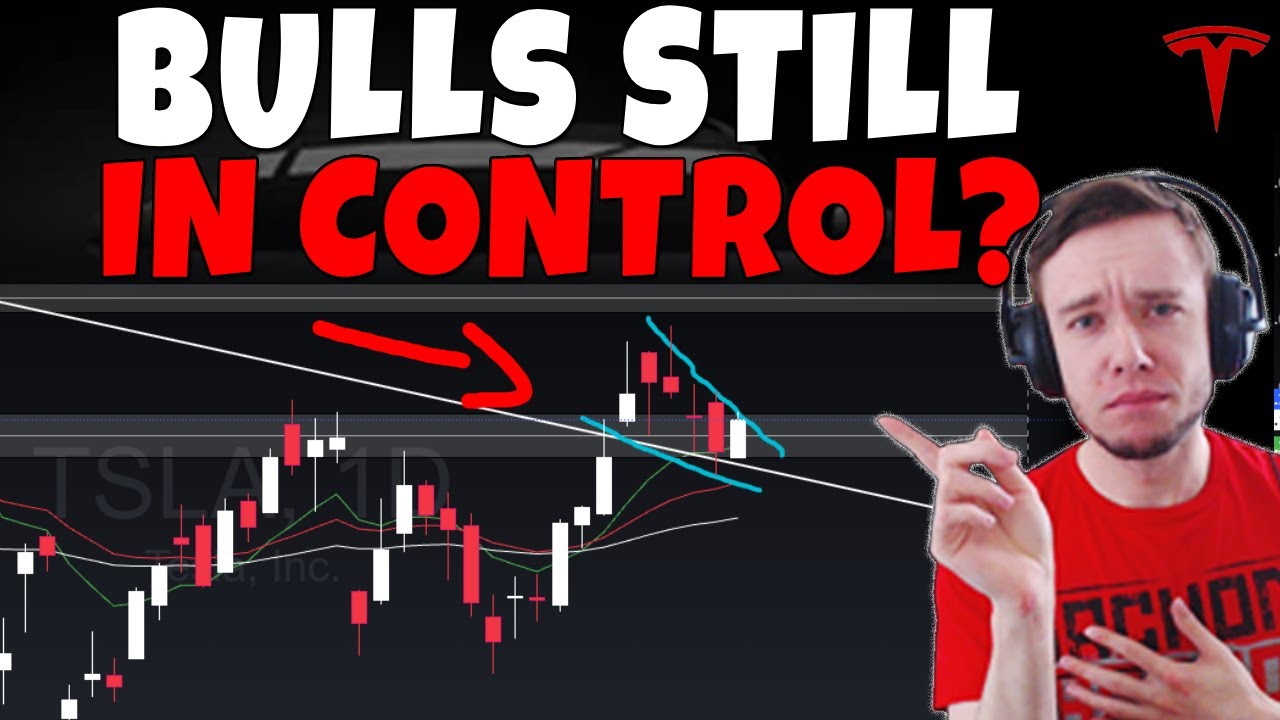
- 😀 Losing the rising channel would also be a significant bearish signal, suggesting a potential shift in momentum for Tesla's stock.
- 😀 Bearish divergence on the RSI could indicate weakening bullish momentum, but it may take time to play out, possibly over a week or more.
- 😀 A critical support level to watch is $350, which was a major area of resistance. Losing this could further confirm a bearish trend.
- 😀 Despite potential risks, the speaker still maintains a bullish outlook as long as key support levels like $350 are held.
- 😀 If Tesla's stock falls below key support levels, a major correction down to $300 per share could occur, with retests of past resistance zones.
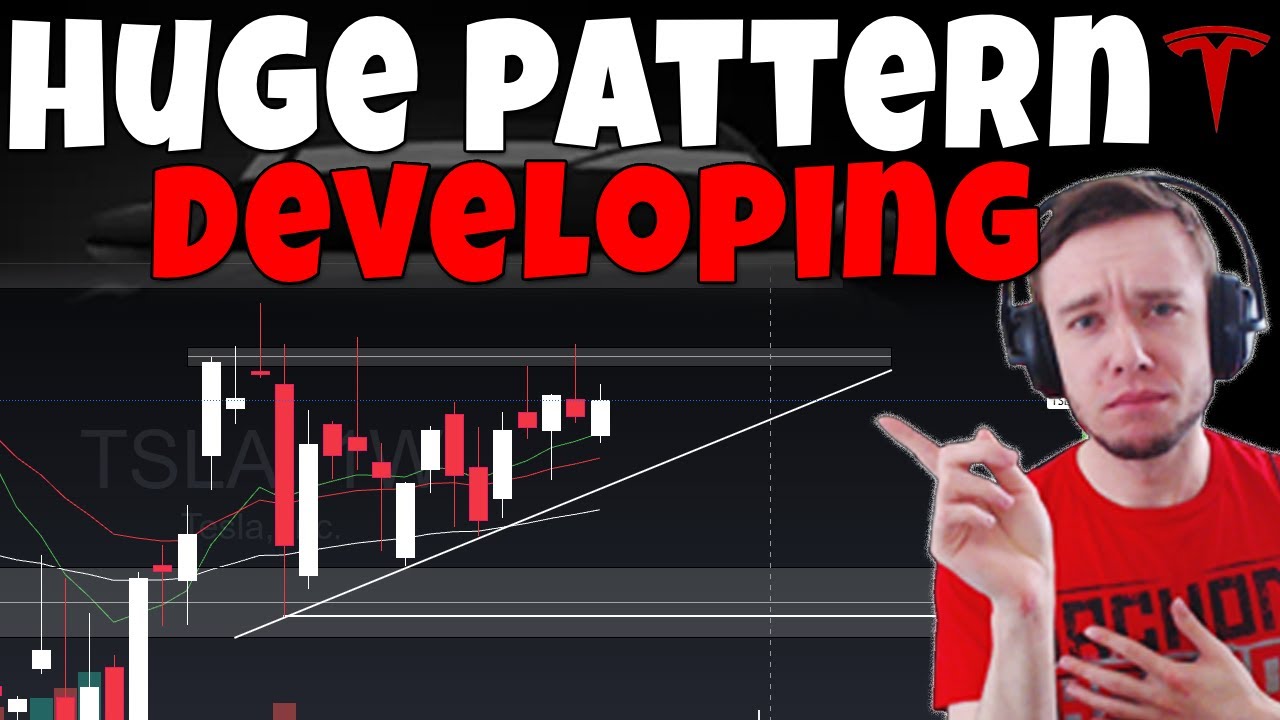
- 😀 The speaker suggests that a cup-and-handle formation could develop if Tesla tops out around $375, potentially leading to a significant bullish move.
- 😀 The speaker is observing mixed options flow, with both calls and puts at various strike prices, but emphasizes not relying heavily on options flow for decision-making.
- 😀 The speaker offers a simple approach to analyzing Tesla's stock, focusing on chart patterns and key levels rather than complex options data.
Q & A
What is the main target price for Tesla according to the speaker?
-The main target price for Tesla is $375 per share, which the speaker believes the stock could potentially reach.
What key indicator is the speaker using to assess Tesla's momentum?
-The speaker is using the 9 Exponential Moving Average (EMA) as a key indicator. Losing the 9 EMA would be a significant red flag for the stock's momentum.
What is the significance of the $350 level for Tesla's stock?
-The $350 level is important because it was previously a major area of resistance. If Tesla's price drops back to this level and fails to hold it, it could signal trouble for the stock.
How does the speaker view the current market behavior of Tesla?
-The speaker views the current market behavior of Tesla as largely following the broader market's trend, with some recent gains fading after a sharp rise due to news like the robo-taxi update.
What bearish sign is the speaker concerned about in Tesla’s stock?
-The speaker is concerned about a bearish divergence on the RSI, where Tesla is making higher highs, but the RSI is making lower highs, which could signal a potential weakening of the stock's bullish momentum.
What happens if Tesla loses the rising channel, according to the speaker?
-If Tesla loses the rising channel, it would be a significant red flag, indicating the potential end of the bullish trend and the start of a possible correction.
What is the speaker’s view on the possibility of a correction in Tesla’s stock?
-The speaker believes that a correction is likely at some point, with the first target being around $300 per share, though it’s uncertain when this will happen.
What does the speaker think about the potential cup and handle pattern forming in Tesla’s stock?
-The speaker sees the possibility of a large cup and handle pattern forming, which could lead to a bullish breakout. However, this pattern would take time to develop, potentially over several months.
How does the speaker use options flow in their analysis?
-The speaker mentions that while options flow can provide insight into market sentiment, they do not rely heavily on it to guide their trading decisions, unless there is something particularly unusual in the data.
What could potentially happen if Tesla holds the $350 level despite recent fluctuations?
-If Tesla holds the $350 level, the speaker believes the stock could still push higher toward the $375 target, as long as key support levels are maintained and the market remains bullish.
Outlines

このセクションは有料ユーザー限定です。 アクセスするには、アップグレードをお願いします。
今すぐアップグレードMindmap

このセクションは有料ユーザー限定です。 アクセスするには、アップグレードをお願いします。
今すぐアップグレードKeywords

このセクションは有料ユーザー限定です。 アクセスするには、アップグレードをお願いします。
今すぐアップグレードHighlights

このセクションは有料ユーザー限定です。 アクセスするには、アップグレードをお願いします。
今すぐアップグレードTranscripts

このセクションは有料ユーザー限定です。 アクセスするには、アップグレードをお願いします。
今すぐアップグレード


5.0 / 5 (0 votes)
