StatQuest: PCA in Python
Summary
TLDRIn this StatQuest episode, Josh Stormer walks through the process of performing Principal Component Analysis (PCA) in Python, using a made-up dataset. He covers key steps like data scaling, applying PCA with scikit-learn, and determining how much variation each principal component accounts for. Josh also demonstrates how to create PCA graphs using matplotlib, including a scree plot and a scatter plot to visualize sample clustering. Finally, he explores loading scores to identify the genes with the greatest impact on the data separation, wrapping up with a clear explanation of PCA and its application in data analysis.
Takeaways
- 😀 The tutorial focuses on explaining how to perform Principal Component Analysis (PCA) in Python using the scikit-learn library.
- 😀 Before diving into PCA, the script highlights the importance of importing necessary packages like pandas, numpy, matplotlib, and scikit-learn.
- 😀 The script emphasizes the need for generating a sample dataset, which includes creating random gene and sample names.
- 😀 The dataset in the example is made up of 100 genes and 10 samples (5 wild-type and 5 knockout), with data generated from Poisson distributions.
- 😀 It is explained that centering and scaling the data are crucial steps before applying PCA to ensure accurate analysis.
- 😀 The script discusses the differences between centering/scaling in scikit-learn and R, particularly with how variation is calculated.
- 😀 A PCA object is created and fitted using the scaled data, which results in the calculation of loading scores and principal components.
- 😀 A scree plot is drawn to visualize the variation each principal component accounts for and help determine how many components to include.
- 😀 A PCA plot is then created to display the relationships and separation between wild-type and knockout samples along the principal components.
- 😀 The loading scores of the first principal component are examined to identify the genes that have the most influence on the separation between sample types.
- 😀 The script concludes with a demonstration of how to identify the top genes contributing to the principal components, and encourages viewers to subscribe for more tutorials.
Q & A
What is Principal Component Analysis (PCA)?
-PCA is a statistical technique used to reduce the dimensionality of data by transforming it into a new set of variables, called principal components. These components capture the most variance in the data, allowing for simpler analysis and visualization.
Why do we need to center and scale the data before performing PCA?
-Centering and scaling the data is necessary because PCA is sensitive to the variance of each feature. If one feature has a much larger range than others, it could dominate the analysis. Centering (subtracting the mean) and scaling (dividing by the standard deviation) ensures that all features contribute equally to the PCA.
What are the principal components in PCA?
-Principal components are new variables created by PCA that are linear combinations of the original features. Each principal component explains a certain percentage of the total variance in the data. The first component (PC1) captures the most variance, followed by the second component (PC2), and so on.
What is the purpose of a scree plot in PCA?
-A scree plot is used to visualize how much variance each principal component accounts for. It helps determine how many principal components should be included in the final analysis by showing the relative importance of each component.
Why is PCA useful in data analysis?
-PCA is useful because it simplifies complex datasets by reducing the number of dimensions while retaining most of the variability in the data. This makes it easier to visualize, interpret, and analyze large datasets, especially when there are many features.
How does PCA help in visualizing data?
-PCA helps visualize high-dimensional data by reducing it to 2D or 3D space. By plotting the first two principal components, we can visually examine how the samples group or separate, which is particularly helpful for identifying patterns or clusters in the data.
What does a PCA plot show?
-A PCA plot visualizes the relationship between samples based on their principal components. Samples that are similar will be clustered together, while dissimilar samples will be farther apart. It helps to highlight patterns, trends, and outliers in the data.
How are loading scores used in PCA?
-Loading scores indicate the contribution of each original variable (feature) to a principal component. By examining the loading scores, we can identify which features have the largest impact on the variation captured by each principal component.
What is the role of the `StandardScaler` in PCA?
-The `StandardScaler` in scikit-learn is used to scale the data before performing PCA. It standardizes the features by removing the mean and scaling to unit variance, ensuring that all features contribute equally to the PCA without being dominated by features with larger magnitudes.
Can you explain the difference between `fit()` and `transform()` in scikit-learn's PCA?
-`fit()` is used to compute the principal components of the data, while `transform()` applies the PCA transformation to the data, creating the new coordinates for the samples in the reduced-dimensional space. Together, these methods are used to perform PCA analysis on a dataset.
Outlines

このセクションは有料ユーザー限定です。 アクセスするには、アップグレードをお願いします。
今すぐアップグレードMindmap

このセクションは有料ユーザー限定です。 アクセスするには、アップグレードをお願いします。
今すぐアップグレードKeywords

このセクションは有料ユーザー限定です。 アクセスするには、アップグレードをお願いします。
今すぐアップグレードHighlights

このセクションは有料ユーザー限定です。 アクセスするには、アップグレードをお願いします。
今すぐアップグレードTranscripts

このセクションは有料ユーザー限定です。 アクセスするには、アップグレードをお願いします。
今すぐアップグレード関連動画をさらに表示
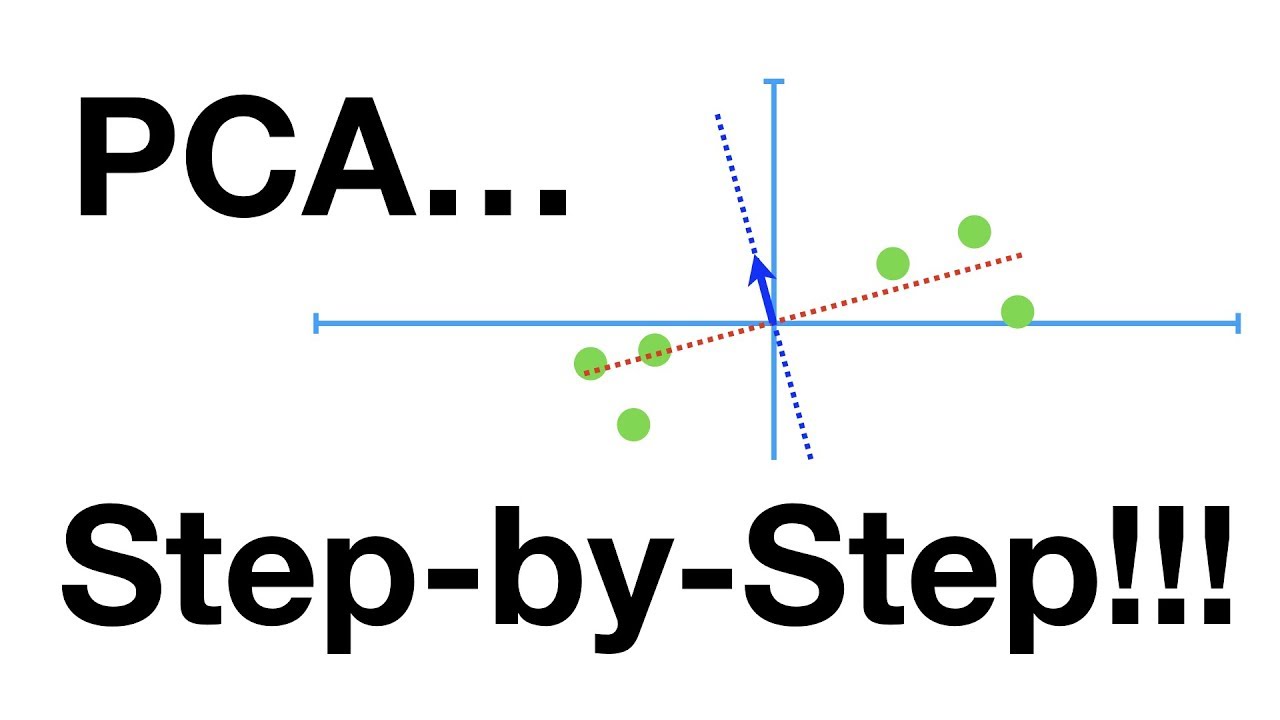
StatQuest: Principal Component Analysis (PCA), Step-by-Step

PCA Algorithm | Principal Component Analysis Algorithm | PCA in Machine Learning by Mahesh Huddar
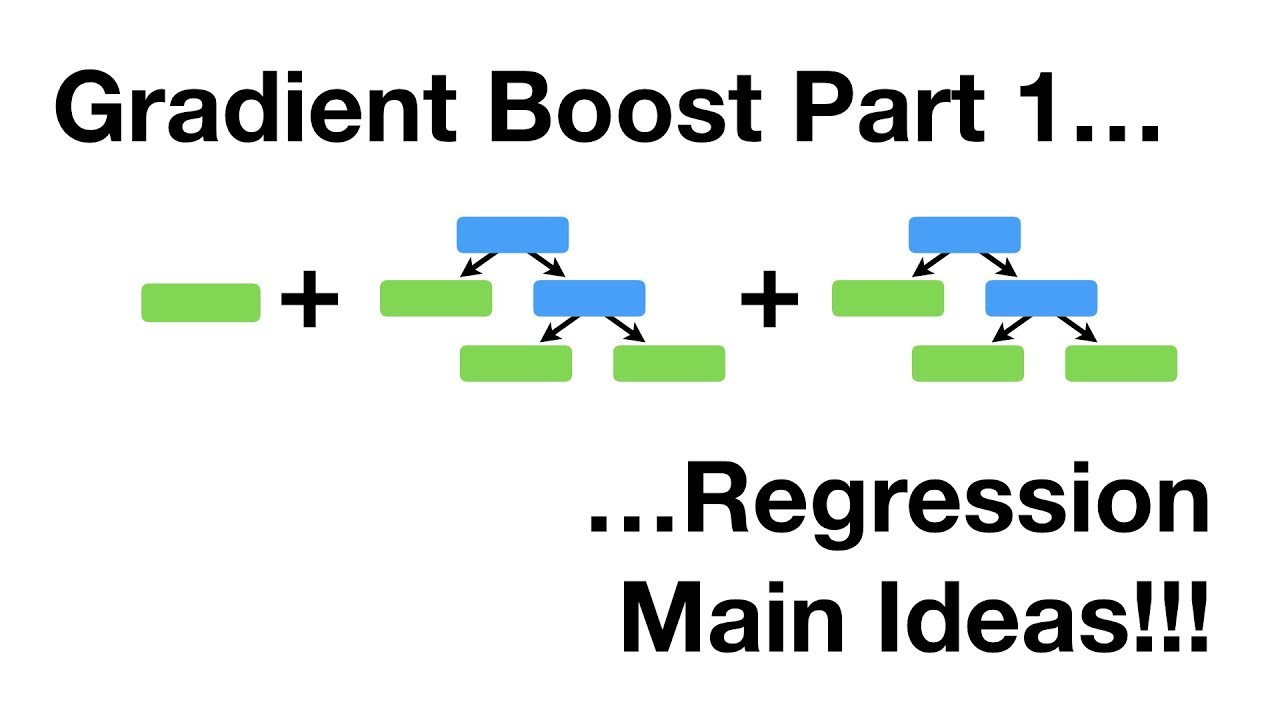
Gradient Boost Part 1 (of 4): Regression Main Ideas

StatQuest: PCA main ideas in only 5 minutes!!!
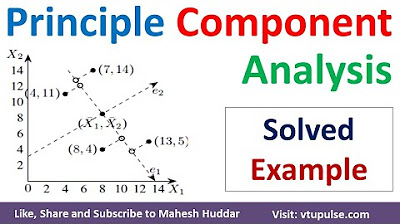
1 Principal Component Analysis | PCA | Dimensionality Reduction in Machine Learning by Mahesh Huddar
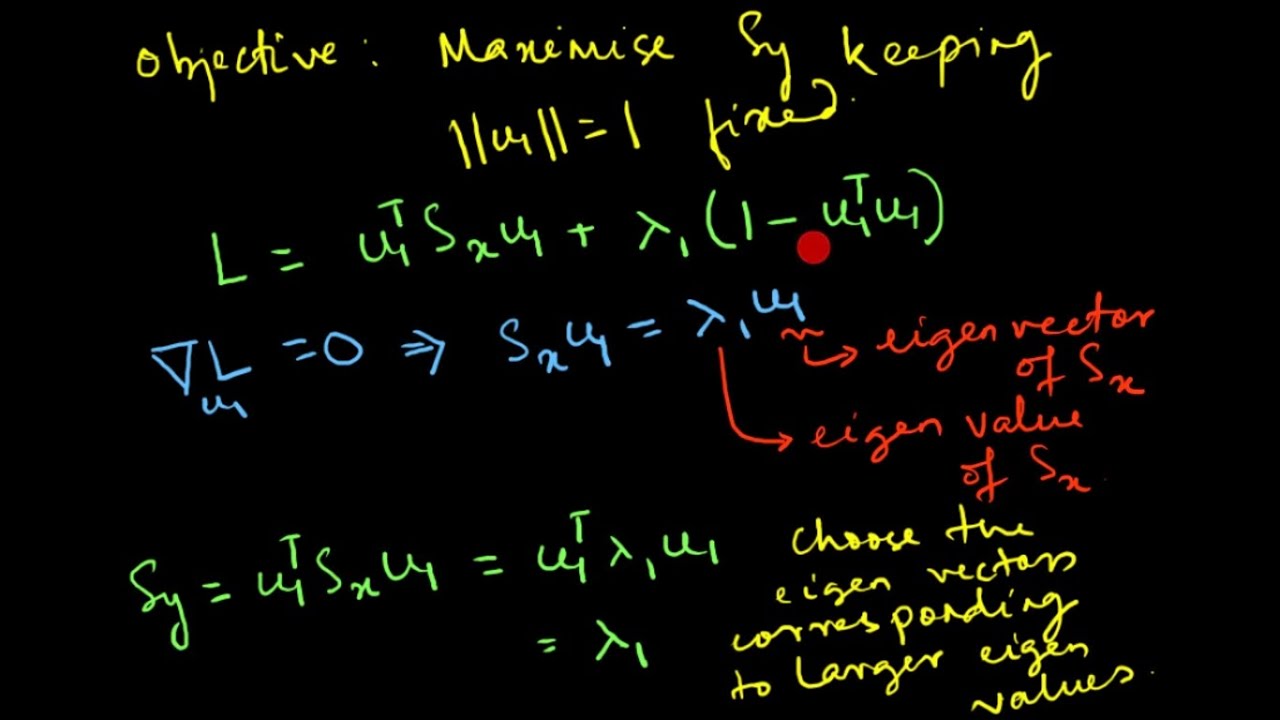
Principal Component Analysis (PCA) : Mathematical Derivation
5.0 / 5 (0 votes)
