How to use FIXED RANGE VOLUME PROFILE (1 Minute Tutorial)
Summary
TLDRIn this video, the speaker demonstrates how they predict bounces in trading using the Fixed Range Volume Profile tool on TradingView. They explain how to identify consolidation areas, apply the tool, and select a specific range. The speaker shares their personal experience of using this method to make a profitable short trade, which resulted in a significant gain on SPX puts. The method involves analyzing the volume profile to spot key levels and trends, helping traders make informed decisions on entry and exit points for trades.
Takeaways
- 😀 The speaker uses the fixed range volume profile as a key tool in predicting market bounces.
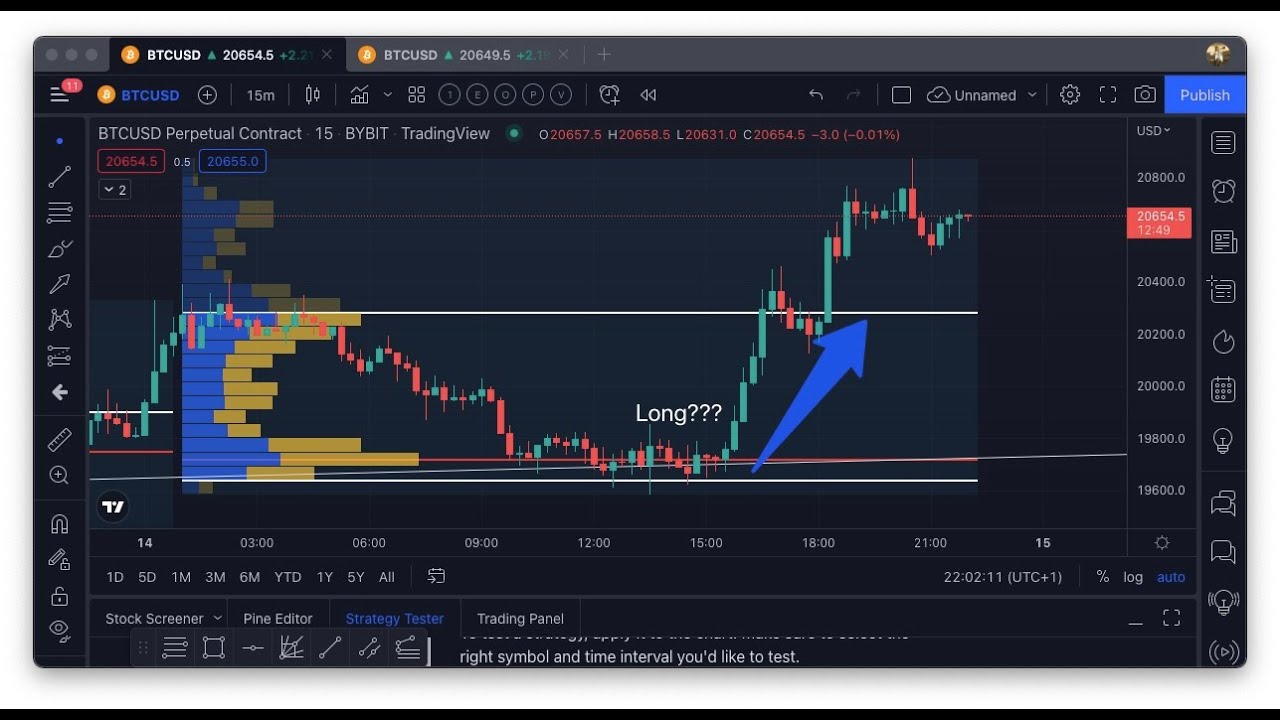
- 📊 The speaker demonstrates how to find a consolidation area on TradingView for analysis.
- 🖱️ To use the fixed range volume profile, the speaker clicks on the indicator and selects the desired range.
- 📏 A red line appears to show the selected range, which the speaker uses as a reference point for further analysis.
- ⚡ The speaker places a yellow line on top of the red line to mark the key price level.
- 🧹 After selecting the range, the speaker removes the fixed range volume profile to zoom in for a closer look.
- 📉 The speaker highlights a short trade they made previously using this method on SPX puts, capturing a 50-point gain.
- 📅 The speaker mentions that the market broke the key level the next day, leading to a significant price drop.
- 🔥 The price action following the break resulted in a 'waterfall' effect, which provided a further trading opportunity to the downside.
- 💡 The speaker emphasizes the effectiveness of this method in enhancing their trading strategy and predicting market movements.
Q & A
What is the purpose of using the fixed range volume profile in trading?
-The fixed range volume profile is used to identify key price levels where consolidation has occurred, helping traders predict future price movements, such as potential bounces or breaks.
How does the trader determine where to place the fixed range volume profile?
-The trader looks for a consolidation area on the chart and then places the fixed range volume profile over that range to analyze volume distribution and price action.
What is the significance of the red line in the fixed range volume profile?
-The red line indicates a key price level that the trader monitors for potential bounces or breaks in the price action.
What is the purpose of placing a yellow line on top of the red line in the video?
-The yellow line marks a specific price level where the trader identifies an important point of interest, often used to track the breakout or failure of that level.
What happens after the trader deletes the fixed range volume profile?
-Once the fixed range volume profile is deleted, the trader zooms in on the chart to focus on the price action around the identified key level.
How did the trader use the fixed range volume profile to make a short trade?
-The trader identified a significant level using the fixed range volume profile and placed a short trade after seeing price action that suggested a potential downside movement, ultimately profiting from a drop in SPX.
What happened after the trader placed the short trade?
-After the short trade was placed, the price broke below the identified level and sold off rapidly, resulting in a profitable move to the downside.
What does the term 'waterfall' refer to in the context of the trader's description?
-'Waterfall' refers to a steep, rapid decline in price, which the trader capitalized on for additional profits after breaking through a key support level.
Why did the trader refer to the play as a 'sweet play'?
-The trader called it a 'sweet play' because the trade was successful, as the price movement aligned with their prediction, resulting in significant profits.
How did the trader's use of the fixed range volume profile elevate their trading game?
-The trader found that using the fixed range volume profile allowed for more precise predictions of price movements, improving their ability to make profitable trades based on volume and price action analysis.
Outlines

このセクションは有料ユーザー限定です。 アクセスするには、アップグレードをお願いします。
今すぐアップグレードMindmap

このセクションは有料ユーザー限定です。 アクセスするには、アップグレードをお願いします。
今すぐアップグレードKeywords

このセクションは有料ユーザー限定です。 アクセスするには、アップグレードをお願いします。
今すぐアップグレードHighlights

このセクションは有料ユーザー限定です。 アクセスするには、アップグレードをお願いします。
今すぐアップグレードTranscripts

このセクションは有料ユーザー限定です。 アクセスするには、アップグレードをお願いします。
今すぐアップグレード関連動画をさらに表示
Master the Fixed Range Volume Profile!!!

Secret Volume Trading Strategy VRPR | How To Trade Volume Profile

Best AI TradingView Indicator in 2024 | 100% Winning Strategy 🔥

Volume Profile Trading Examples: Walkthrough

Binance futures trading strategies turn $1000 to $10 000 | how to trade binance futures
The MOST POWERFUL Day Trading Indicator
5.0 / 5 (0 votes)
