Soal & Pembahasan SPTLDV Sistem Pertidaksamaan Linear Dua Variabel SOAL CERITA
Summary
TLDRThis educational video delves into solving systems of linear inequalities, focusing on graphing solution regions and interpreting mathematical constraints. The instructor demonstrates step-by-step solutions to various problems, explaining how to represent inequalities on a graph and shade solution areas. Additionally, the video addresses how to create mathematical models for real-life scenarios, such as a rice trader managing storage capacity and a coffee trader working within a budget. The video offers clear guidance on translating word problems into inequalities, making it an excellent resource for students learning about linear systems in mathematics.
Takeaways
- 😀 Understanding how to solve linear inequalities with two variables, focusing on graphical solutions.
- 😀 The importance of interpreting the inequality graphically to visualize the solution regions on the coordinate plane.
- 😀 How to graph linear inequalities by first identifying the boundary line and shading the region that satisfies the inequality.
- 😀 The concept of 'solution regions' where the values of the variables satisfy the inequality constraints.
- 😀 Techniques for identifying and labeling key points, such as intercepts and intersection points, on a graph.
- 😀 How to set up mathematical models for real-world scenarios, such as a rice merchant problem, to represent constraints and optimize decisions.
- 😀 The use of test points to determine which side of the inequality line is the correct solution region.
- 😀 Translating narrative word problems into systems of inequalities, focusing on constraints like price and quantity.
- 😀 The process of simplifying and solving word problems to obtain linear inequalities and graph them for visual solutions.
- 😀 Practical examples of how inequalities are applied in business scenarios (e.g., rice and coffee merchants) to make decisions within given constraints.
Q & A
What is the main topic discussed in the video?
-The main topic of the video is the discussion of linear inequalities in two variables, focusing on how to solve them both graphically and algebraically.
What are the two main types of problems presented in the video?
-The two main types of problems are graphical problems, where the solution is a region in a coordinate plane, and word problems, where mathematical models for real-world situations are developed.
How does the video approach solving a linear inequality graphically?
-The video explains solving linear inequalities graphically by first converting the inequality into an equation, finding the intercepts, and then determining the region that satisfies the inequality using shading or other graphical techniques.
In the first problem, what is the inequality given, and how is it solved?
-The inequality given is X ≥ -3. The solution involves plotting the line X = -3 on the coordinate plane, shading the region to the right of this line since X must be greater than or equal to -3.
What is the role of the test points in solving the inequalities?
-Test points are used to check whether a region satisfies the inequality. For example, points like (0,0) are substituted into the inequality to see if they make the inequality true or false, helping to determine the correct shaded region.
What does the phrase 'tidak lebih dari' mean in the word problems?
-'Tidak lebih dari' translates to 'not more than,' indicating a less than or equal to condition in the mathematical inequality.
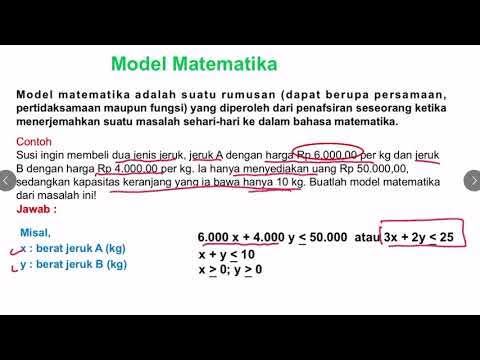
In the rice seller word problem, what are the constraints for the amount of rice the seller can purchase?
-The seller is constrained by the total weight of the rice, which cannot exceed 6000 kg. Additionally, there are financial constraints based on the cost per kilogram of the two types of rice.
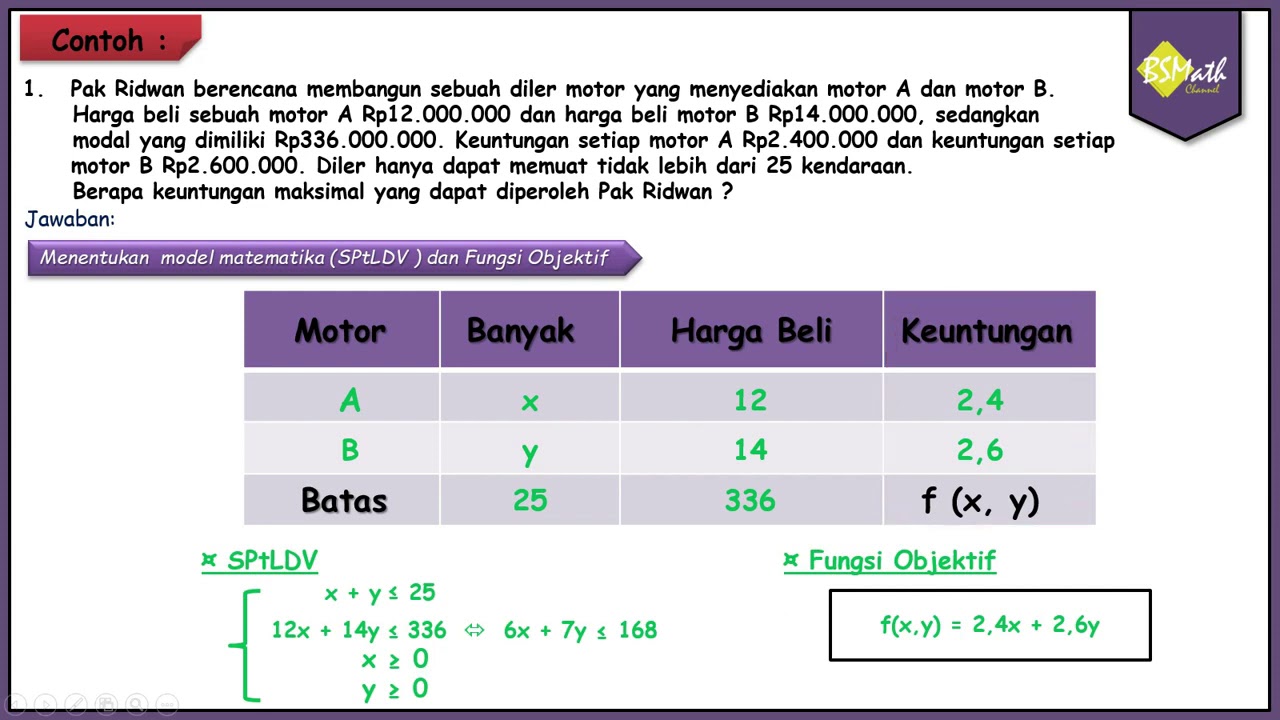
How is the mathematical model developed for the rice seller problem?
-The model is developed by writing two inequalities: one for the weight constraint (X + Y ≤ 6000) and one for the cost constraint (12000X + 10000Y ≤ 48000), where X and Y represent the quantities of each type of rice purchased.
How does the video suggest handling inequalities involving multiple variables?
-The video suggests simplifying the inequality into a system of equations, solving for the intercepts, and then graphically determining the solution region by testing points and shading accordingly.
What is the importance of shading in graphical solutions of inequalities?
-Shading represents the solution region on the graph, indicating all points that satisfy the inequality. Different rules for shading (such as including or excluding boundary lines) depend on the type of inequality (strict or non-strict).
Outlines

このセクションは有料ユーザー限定です。 アクセスするには、アップグレードをお願いします。
今すぐアップグレードMindmap

このセクションは有料ユーザー限定です。 アクセスするには、アップグレードをお願いします。
今すぐアップグレードKeywords

このセクションは有料ユーザー限定です。 アクセスするには、アップグレードをお願いします。
今すぐアップグレードHighlights

このセクションは有料ユーザー限定です。 アクセスするには、アップグレードをお願いします。
今すぐアップグレードTranscripts

このセクションは有料ユーザー限定です。 アクセスするには、アップグレードをお願いします。
今すぐアップグレード関連動画をさらに表示

MATERI UTBK SNBT MATEMATIKA SAINTEK PERTIDAKSAMAAN KUADRAT
SPtLDV (Sistem Pertidaksamaan Linear Dua Variabel) Kelas 10 Kurikulum Merdeka
MENENTUKAN MODEL MATEMATIKA DARI SOAL CERITA SPtLDV
Menyelesaikan Permasalahan Program Linear Menentukan Nilai Optimum dengan Metode Uji Titik Pojok
Pembahasan Buku PR Matematika Kelas XB Intan Pariwara|Asesmen 2 Pilihan Ganda No.1-10|Kurmer

Bonar memiliki dua pekerjaan paruh waktu. Untuk mengantar barang, Bonar dibayar Rp 15.000,00 per ...
5.0 / 5 (0 votes)
