Ukuran Penyebaran Data | Statistika Kelas 8
Summary
TLDRThis educational video provides an in-depth explanation of data spread measures for 8th-grade statistics. It covers four key concepts: range, quartiles, interquartile range, and quartile deviation. The script explains how to calculate these measures using examples, including step-by-step processes for finding the range, determining quartiles, and calculating the interquartile range and quartile deviation. The video includes practical exercises to help students understand these concepts, encouraging them to apply these techniques to solve real-world statistical problems.
Takeaways
- 😀 Data spread measures include range, quartiles, interquartile range, and semi-interquartile range.
- 😀 The range (R) is calculated as the difference between the maximum and minimum values in a dataset.
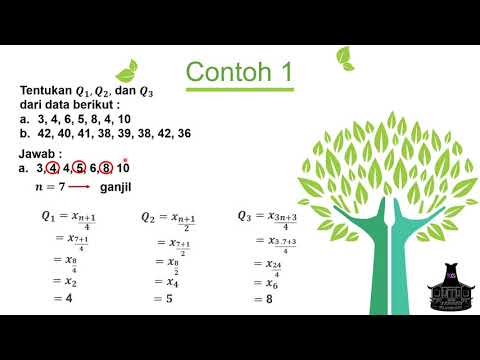
- 😀 Quartiles divide data into four equal parts after sorting it in ascending order, with Q1 being the first quartile, Q2 being the median, and Q3 being the third quartile.
- 😀 The formula for finding the position of Q1, Q2, and Q3 involves using N (the number of data points), where Q1 is located at (1/4 * (N + 1)), Q2 at (2/4 * (N + 1)), and Q3 at (3/4 * (N + 1)).
- 😀 The interquartile range (IQR) is calculated by subtracting Q1 from Q3, providing insight into the spread of the middle 50% of the data.
- 😀 Semi-interquartile range (SIQR) is half of the interquartile range and is calculated as (Q3 - Q1)/2.
- 😀 When calculating the range of a dataset, subtract the smallest value from the largest value.
- 😀 In an ordered dataset, Q1 is the value at the first quartile, Q2 is the median value, and Q3 is the value at the third quartile.
- 😀 The interquartile range (IQR) helps in understanding the spread between the first and third quartiles, and is critical for identifying outliers.
- 😀 When working with grouped data, use cumulative frequency tables to calculate quartiles and other statistical measures.
Q & A
What is the range (R) of a data set?
-The range (R) is the difference between the largest and smallest values in a data set. It is calculated as R = X_max - X_min, where X_max is the maximum value and X_min is the minimum value.
How do you calculate the first quartile (Q1)?
-The first quartile (Q1) is calculated by finding the position of the data that is 1/4 of the way through the data set. The formula for the position is Q1 = (1/4) * (N + 1), where N is the number of data points.
What is the interquartile range (IQR) or 'hamparan'?
-The interquartile range (IQR) is the difference between the third quartile (Q3) and the first quartile (Q1). It is calculated as IQR = Q3 - Q1.
What does the symbol 'Q&D' represent?
-'Q&D' represents the semi-interquartile range, which is half of the interquartile range. It is calculated as Q&D = 1/2 * (Q3 - Q1).
How do you determine the position of the median (Q2) in a data set?
-The median (Q2) is the middle value in an ordered data set. If the number of data points (N) is odd, Q2 is the middle data point. If N is even, Q2 is the average of the two middle data points.
In the context of the provided data, how would you calculate Q3 and Q1 for a frequency distribution table?
-For a frequency distribution table, you first calculate the cumulative frequency. Then, use the position formulas Q1 = (1/4) * (N + 1) and Q3 = (3/4) * (N + 1) to determine the values of Q1 and Q3. These positions guide you to the data points that correspond to these quartiles.
What does the concept of 'frekuensi kumulatif' (cumulative frequency) help in the calculation of quartiles?
-Cumulative frequency helps in determining the exact position of quartiles in a data set, especially when dealing with grouped data or frequency distributions. It allows you to locate the values of Q1 and Q3 by identifying the cumulative count up to certain data points.
In the example problem with 11 data points, how is the position of Q1 calculated?
-For 11 data points, the position of Q1 is calculated as Q1 = (1/4) * (11 + 1) = 12/4 = 3, meaning Q1 corresponds to the third data point in the ordered set.
What happens if the number of data points (N) is even in calculating the median?
-When N is even, the median (Q2) is the average of the two middle data points. For example, if the data set is ordered and has an even number of values, the median is calculated as the average of the values in positions N/2 and (N/2 + 1).
In the given example with a frequency distribution, how do you calculate the interquartile range (IQR) from the quartiles?
-The interquartile range (IQR) is the difference between the third quartile (Q3) and the first quartile (Q1). For example, if Q3 is 90 and Q1 is 65, the IQR is calculated as IQR = 90 - 65 = 25.
Outlines

このセクションは有料ユーザー限定です。 アクセスするには、アップグレードをお願いします。
今すぐアップグレードMindmap

このセクションは有料ユーザー限定です。 アクセスするには、アップグレードをお願いします。
今すぐアップグレードKeywords

このセクションは有料ユーザー限定です。 アクセスするには、アップグレードをお願いします。
今すぐアップグレードHighlights

このセクションは有料ユーザー限定です。 アクセスするには、アップグレードをお願いします。
今すぐアップグレードTranscripts

このセクションは有料ユーザー限定です。 アクセスするには、アップグレードをお願いします。
今すぐアップグレード関連動画をさらに表示

Belajar Statistika SMP - Pengantar
Ukuran Penyebaran Data : Kuartil, Desil dan Persentil + Contoh Soal
KULIAH STATISTIK (6) - UKURAN VARIABILITAS DATA

Menentukan Kuartil Q1 Q2 Q3 Median Mean Modus Statistika kelas 12

Statistika part #1~ PJJ Matematika Kelas XII #diagrambatang #diagramlingkaran #diagramgaris
Statistik Deskriptif
5.0 / 5 (0 votes)
