(Trigono I)grafik sinus
Summary
TLDRThis video tutorial provides a detailed explanation on graphing trigonometric functions, focusing on the sine function (y = sin x). It covers key concepts such as amplitude, period, and phase shifts, and shows how transformations of the sine graph occur with changes in the equation. The presenter demonstrates various examples, including how to graph functions like y = 3sin(2x) and y = 3sin(2x + 180), while explaining how these transformations affect the graph’s maximum, minimum, and period. The tutorial is aimed at helping students understand and visualize sine wave transformations.
Takeaways
- 😀 The graph of the sine function starts at zero, increases to its maximum, decreases, and returns to zero, repeating this pattern.
- 😀 The maximum and minimum values of the sine function are determined by the coefficient 'a' in the equation y = a * sin(x).
- 😀 The amplitude of the sine function is the absolute value of 'a', which determines how high or low the graph goes from the centerline.
- 😀 The period of the sine function is determined by the coefficient 'k' in the equation y = a * sin(kx), and it can be calculated as 360° divided by k.
- 😀 Horizontal shifts in the sine graph are controlled by the parameter 'alpha' in the equation y = a * sin(kx + alpha). Positive alpha values shift the graph to the right, while negative alpha values shift it to the left.
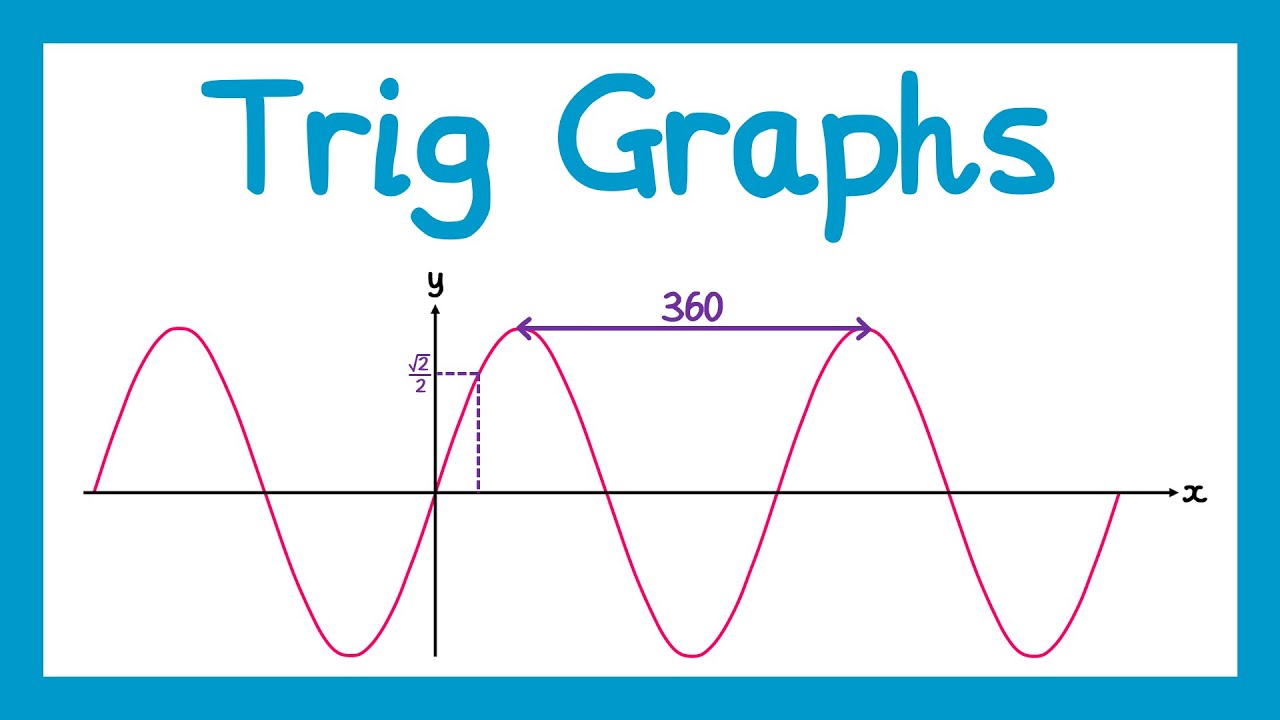
- 😀 The standard sine function y = sin(x) has a period of 360° and an amplitude of 1.
- 😀 For a sine function like y = 3 sin(2x), the amplitude is 3, the period is 180° (calculated as 360°/2), and the graph completes one cycle in 180°.
- 😀 The graph of y = 3 sin(2x) can be plotted by determining its maximum and minimum values (3 and -3, respectively) and drawing the sine curve with these values.
- 😀 The phase shift for a sine function can be calculated using the value of 'alpha'. A positive shift moves the graph to the right, while a negative shift moves it to the left.
- 😀 For transformations involving both amplitude and phase shift, such as y = 3 sin(2x + 180°), the graph should be plotted with adjustments for amplitude (3), period (180°), and a leftward shift of 90° due to the 180° phase shift.
Q & A
What is the basic form of the sine wave graph discussed in the script?
-The basic form of the sine wave graph is given by the equation y = sin(x). This graph oscillates between a maximum and minimum value, typically ranging from +1 to -1.
What does the 'a' parameter in the sine function equation represent?
-The 'a' parameter in the sine function equation represents the amplitude of the graph. It determines the maximum and minimum values of the sine wave. For example, if 'a' is 3, the graph will oscillate between +3 and -3.
How is the period of the sine graph determined?
-The period of the sine graph is determined by the 'k' value in the equation y = a * sin(kx). The period is calculated as 360° divided by the value of 'k'. For instance, if k = 2, the period is 360° / 2 = 180°.
What happens to the graph when the 'k' value is increased?
-Increasing the 'k' value compresses the graph horizontally, meaning the sine wave will complete its cycle more quickly, resulting in a shorter period.
What effect does a positive phase shift (alpha) have on the sine graph?
-A positive phase shift (alpha) causes the graph to shift to the right. The amount of shift depends on the value of alpha. For example, if alpha is 90°, the entire sine wave will shift 90° to the right.
How does a negative phase shift (alpha) affect the graph?
-A negative phase shift (alpha) causes the graph to shift to the left. The magnitude of the shift corresponds to the value of alpha. For example, if alpha is -90°, the sine wave will shift 90° to the left.
What is the difference between the maximum and minimum values of the sine wave in terms of the amplitude?
-The maximum value of the sine wave is equal to the amplitude (a), and the minimum value is the negative of the amplitude (-a). For example, if a = 3, the maximum is +3, and the minimum is -3.
In the example y = 3 * sin(2x), how is the graph modified?
-In the equation y = 3 * sin(2x), the amplitude is 3, meaning the graph oscillates between +3 and -3. The period is 360° / 2 = 180°, so the sine wave completes one cycle every 180° instead of 360°.
What happens if the equation of the sine function has a phase shift of +180°?
-A phase shift of +180° causes the entire sine graph to shift 180° to the right. The graph will start at a different point along the x-axis, altering the location of the peaks and troughs.
What is the significance of using dotted lines in the graph?
-Dotted lines are used to indicate auxiliary lines or reference lines on the graph. These lines help to visualize key points like the maximum, minimum, and midpoint, making it easier to interpret the sine wave's behavior.
Outlines

このセクションは有料ユーザー限定です。 アクセスするには、アップグレードをお願いします。
今すぐアップグレードMindmap

このセクションは有料ユーザー限定です。 アクセスするには、アップグレードをお願いします。
今すぐアップグレードKeywords

このセクションは有料ユーザー限定です。 アクセスするには、アップグレードをお願いします。
今すぐアップグレードHighlights

このセクションは有料ユーザー限定です。 アクセスするには、アップグレードをお願いします。
今すぐアップグレードTranscripts

このセクションは有料ユーザー限定です。 アクセスするには、アップグレードをお願いします。
今すぐアップグレード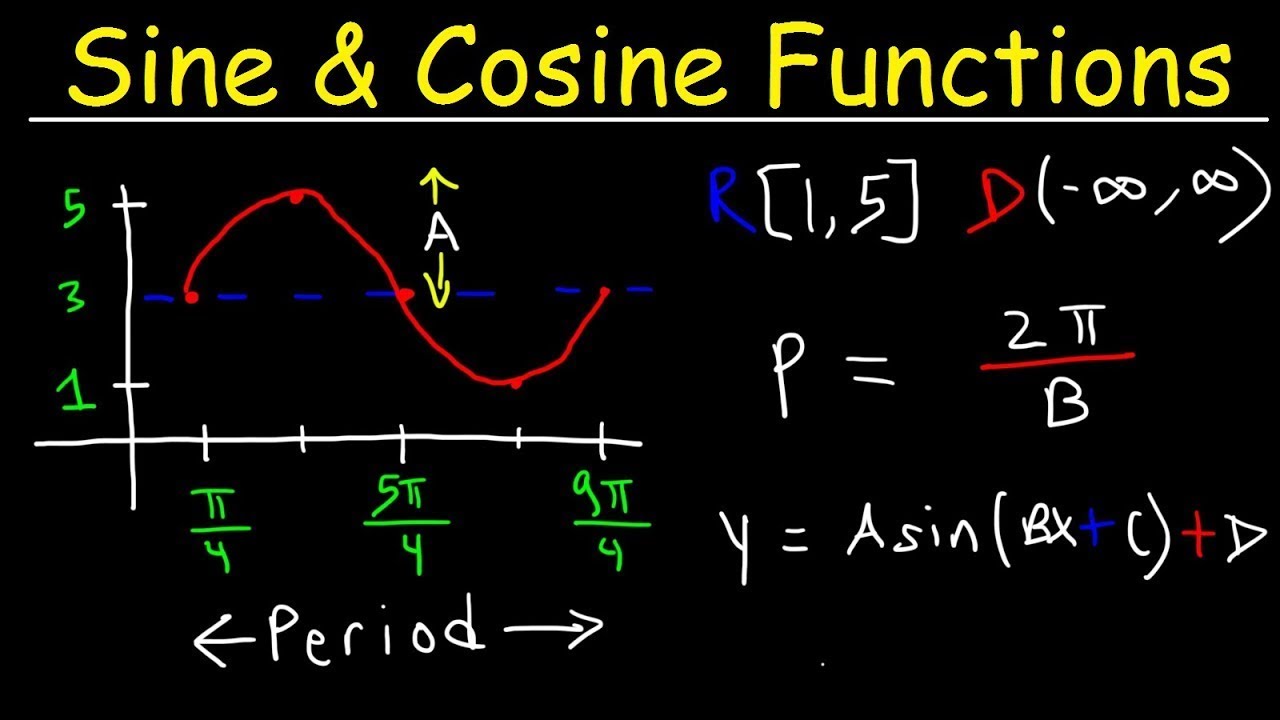

5.0 / 5 (0 votes)
