(KUPAS TUNTAS) Fase MEASURE dalam DMAIC
Summary
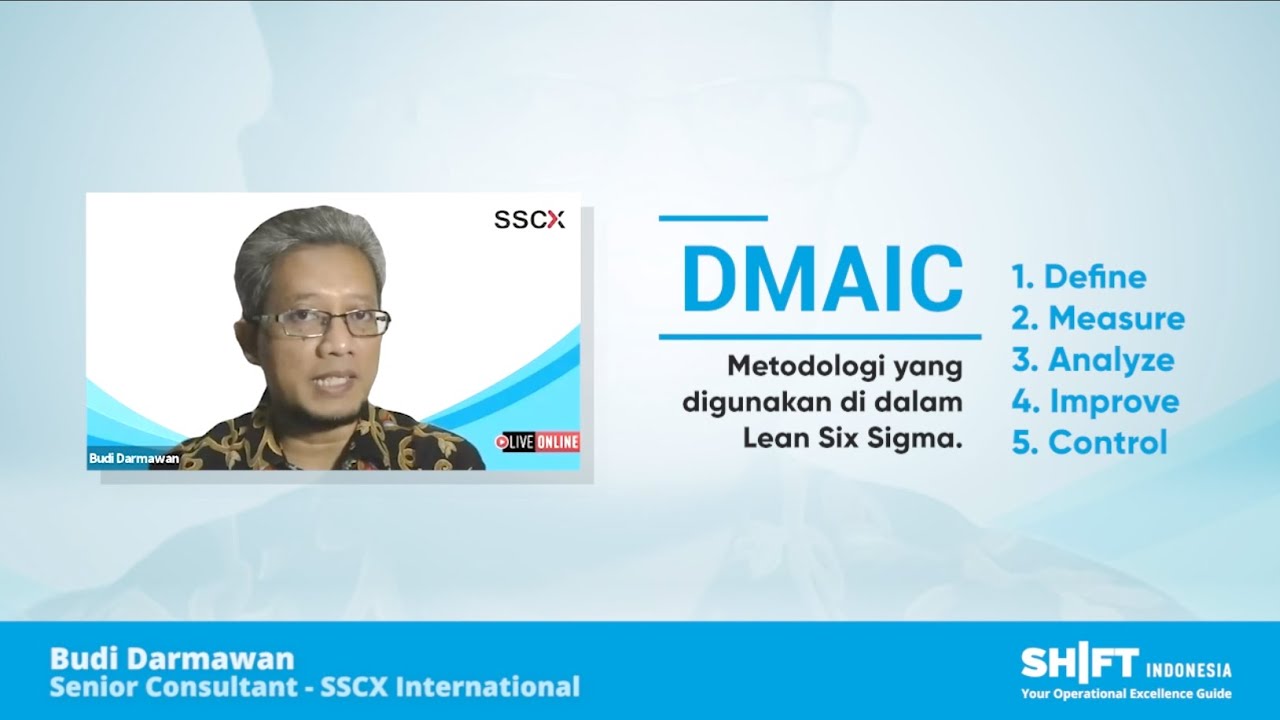
TLDRIn this video, Budi Darmawan, a senior consultant at PT KMI International, introduces the second phase of the DIMAGE methodology—known as 'Meijer.' The main goal of this phase is to gain a detailed understanding of the processes or areas for improvement. The video emphasizes the importance of process mapping, data collection, and ensuring accurate measurement systems to achieve maximum improvement. Budi also highlights the need for simple, low-cost improvements (Quick Improvement) and encourages participants to continuously refine processes throughout the project. The session concludes with an invitation for feedback and future topic suggestions.
Takeaways
- 😀 The second phase in the D-Mage methodology is about gaining a detailed understanding of processes for improvement.
- 😀 The goal of the second phase is to identify the areas that need improvement by visualizing processes in detail.
- 😀 Process mapping, including tools like flowcharts and swim lane diagrams, can help visualize how processes are run step by step.
- 😀 A well-prepared data collection plan is necessary to ensure the collected data is accurate and sufficient.
- 😀 Before gathering data, ensure the measurement system is correct by verifying methods and tools to avoid invalid results.
- 😀 In this phase, the collection of data, like operational time or defects, helps to identify patterns and issues in the process.
- 😀 Data analysis tools, such as graphs and control charts, are used to examine data and identify variations or inconsistencies in the process.
- 😀 Understanding both the 'Y' (output) and 'X' (factors) helps in identifying which variables influence process outcomes.
- 😀 Quick improvement activities, like weekend improvements (QI), can be implemented quickly with little cost and minimal coordination.
- 😀 Quick improvements can be done throughout the project, not just at the end, to continuously enhance the process.
- 😀 The ultimate goal of the second phase is to understand the process in detail, enabling better decision-making for process improvement.
Q & A
What is the main objective of the 'meijer' phase in the methodology?
-The main objective of the 'meijer' phase is to gain a detailed understanding of the processes or areas that are the focus of the improvement project. This allows for identifying issues and potential areas for improvement.
What tools can be used to visualize and map out processes in the 'meijer' phase?
-Various tools can be used to map out processes, such as flowcharts, swimline diagrams, and value stream mapping (VSM). The choice of tool depends on the specific needs of the project.
Why is data collection planning important in the 'meijer' phase?
-Data collection planning is crucial to ensure that the data gathered is relevant, accurate, and sufficient. This prevents the need for repeated data collection and ensures that the collected data supports the improvement efforts effectively.
What is the significance of MSA (Measurement System Analysis) in the 'meijer' phase?
-MSA ensures that the measurement system used for data collection is accurate and reliable. It helps to avoid invalid results caused by errors in the measurement process or faulty measuring instruments.
What kind of data is typically collected during the 'meijer' phase?
-Data related to process performance, such as time measurements (e.g., operational time or cycle time) and other factors impacting the process, is collected. This helps to identify performance trends and areas needing improvement.
What is the role of quick improvements (QI) or 'weekend improvements' in the methodology?
-Quick improvements are simple, low-cost interventions that can be implemented during the project to address small issues or inefficiencies. These improvements are easy to execute, require minimal coordination, and can often be reverted if necessary.
How does the 'meijer' phase help in identifying process issues?
-By analyzing the collected data and mapping out the processes, the 'meijer' phase helps to identify discrepancies or areas where processes deviate from the desired standards. This provides insights into potential root causes of inefficiencies or problems.
Why is it essential to verify the accuracy of measurement methods before data collection?
-Verifying the accuracy of measurement methods is crucial because incorrect measurement techniques or faulty tools can lead to invalid data. This would undermine the effectiveness of the improvement process, making it impossible to achieve reliable results.
What type of visual aids should be used to present the data collected in the 'meijer' phase?
-The collected data should be presented using graphs or charts that help visualize trends, distributions, or deviations. This makes it easier to analyze and draw insights from the data to guide improvements.
How do factors like process time and performance trends help in making improvements?
-By tracking process times and performance trends, it becomes easier to identify inefficiencies or variations that need to be addressed. This data guides decisions on where and how to apply improvements for maximum impact.
Outlines

このセクションは有料ユーザー限定です。 アクセスするには、アップグレードをお願いします。
今すぐアップグレードMindmap

このセクションは有料ユーザー限定です。 アクセスするには、アップグレードをお願いします。
今すぐアップグレードKeywords

このセクションは有料ユーザー限定です。 アクセスするには、アップグレードをお願いします。
今すぐアップグレードHighlights

このセクションは有料ユーザー限定です。 アクセスするには、アップグレードをお願いします。
今すぐアップグレードTranscripts

このセクションは有料ユーザー限定です。 アクセスするには、アップグレードをお願いします。
今すぐアップグレード関連動画をさらに表示


5.0 / 5 (0 votes)
