Statistika Bagian 6 - Persentil Data Tunggal dan Data Kelompok Matematika Wajib Kelas 12
Summary
TLDRIn this educational video, Handayani explains the concept of percentiles, providing a clear breakdown of how to calculate them for both individual and grouped data. The video introduces the formula for finding percentiles, compares them to quartiles and deciles, and demonstrates practical examples. The concept of linear interpolation is discussed to handle non-whole number results. Additionally, Handayani covers the process for calculating percentiles from frequency distributions and histograms. This tutorial is a helpful guide for anyone looking to grasp the process of calculating percentiles in statistics.
Takeaways
- 😀 Percentiles divide data into 100 equal parts after sorting it from smallest to largest.
- 😀 Percentile calculations are similar to those for quartiles and deciles but with a different divisor: 100 for percentiles, 4 for quartiles, and 10 for deciles.
- 😀 When calculating percentiles for individual data, sorting the data is the first step before applying the formula.
- 😀 The formula for finding the position of a specific percentile is: P = (percentile × (n + 1)) / 100, where n is the number of data points.
- 😀 Interpolation is used when the percentile value doesn’t correspond to an exact data point. This is necessary when the result isn’t a whole number.
- 😀 The video explains how to calculate percentiles using interpolation when the position of the percentile falls between two data points.
- 😀 For grouped data, percentiles can be calculated using a similar formula as for individual data, but adjusted for cumulative frequencies and class intervals.
- 😀 For percentiles in grouped data, the formula involves using cumulative frequencies and the class width to determine the exact percentile.
- 😀 The video demonstrates step-by-step calculations of the 15th percentile (P15) and other percentiles (P30, P52) using both single and grouped data examples.
- 😀 It is recommended to first understand quartiles and deciles, as the calculation methods for percentiles are based on similar concepts.
Q & A
What is a percentile in statistics?
-A percentile is a value that divides the data, already ordered from smallest to largest, into 100 equal parts. It helps in understanding the relative position of a value within the data set.
How does a percentile differ from quartiles and deciles?
-A percentile divides the data into 100 equal parts, whereas a quartile divides the data into 4 parts and a decile divides the data into 10 parts.
How do you calculate a percentile for a given data set?
-To calculate a percentile, you first order the data from smallest to largest. Then, use the formula: P = (i × n + 1) / 100, where 'i' is the percentile number and 'n' is the number of data points.
What is the formula for calculating the percentile rank for a data set?
-The formula for finding the percentile rank of a given data point is: P = (i × n + 1) / 100, where 'i' is the percentile and 'n' is the total number of data points.
What is interpolation in percentile calculation?
-Interpolation is used when the percentile rank is not a whole number. In such cases, you calculate the weighted average between two data points to find the exact value.
How do you calculate the 15th percentile (P15) for a data set?
-First, order the data. Then, apply the formula for the 15th percentile. Use the number of data points, and if the result is not a whole number, use interpolation to calculate the value.
What is the procedure for finding percentiles in grouped data?
-For grouped data, you use a modified formula that involves cumulative frequency, frequency of the class, and class boundaries. The formula is: P = L + (( (P/100) × N - F) / f) × w, where L is the lower class boundary, F is the cumulative frequency before the class, f is the frequency of the class, and w is the class width.
What does the term 'frequency' refer to in a frequency distribution?
-Frequency refers to the number of occurrences of a particular value or group of values within a data set.
How do you calculate the 30th percentile (P30) for grouped data?
-For the 30th percentile, you substitute the values into the percentile formula for grouped data. You need the cumulative frequency before the class, the frequency of the class, the class width, and the lower class boundary to calculate P30.
How do you calculate percentiles from a histogram?
-To calculate percentiles from a histogram, you first determine the cumulative frequency, then use the percentile formula for grouped data, adjusting for the class intervals. For example, to find the 37th percentile, identify the class that contains the 37% position in the cumulative frequency, then apply the percentile formula.
Outlines

このセクションは有料ユーザー限定です。 アクセスするには、アップグレードをお願いします。
今すぐアップグレードMindmap

このセクションは有料ユーザー限定です。 アクセスするには、アップグレードをお願いします。
今すぐアップグレードKeywords

このセクションは有料ユーザー限定です。 アクセスするには、アップグレードをお願いします。
今すぐアップグレードHighlights

このセクションは有料ユーザー限定です。 アクセスするには、アップグレードをお願いします。
今すぐアップグレードTranscripts

このセクションは有料ユーザー限定です。 アクセスするには、アップグレードをお願いします。
今すぐアップグレード関連動画をさらに表示
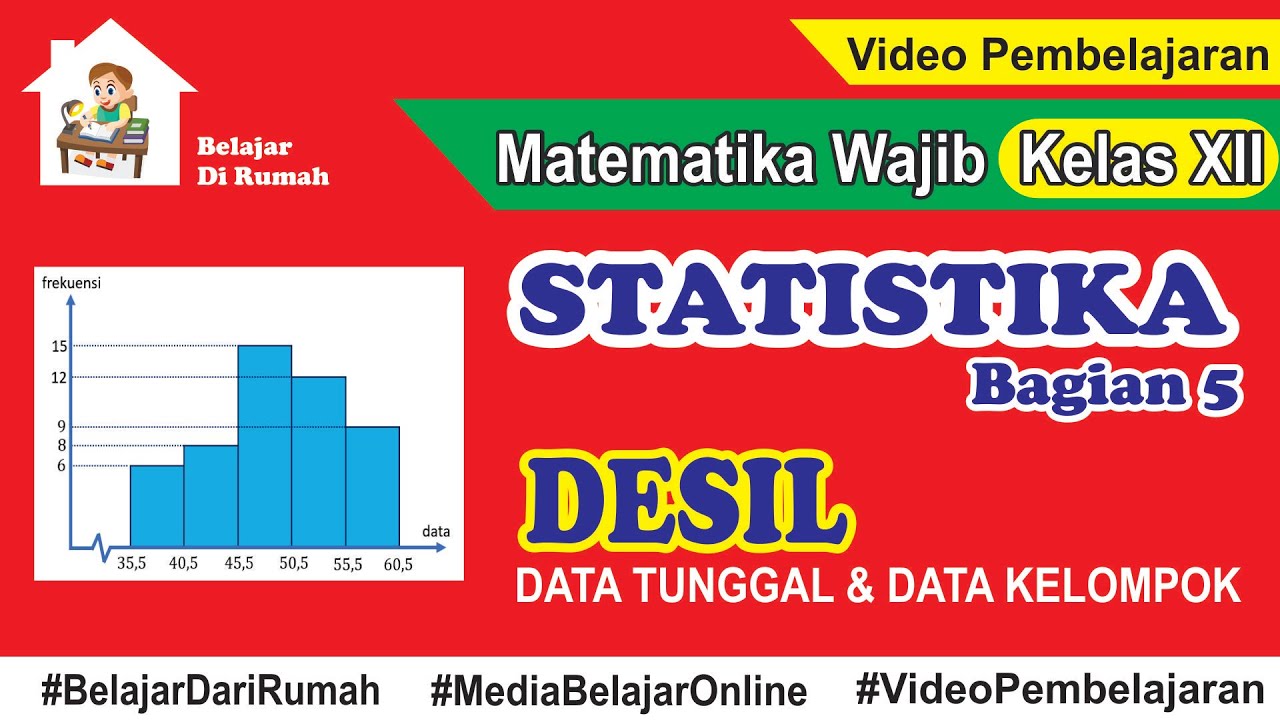
Statistika Bagian 5 - Desil Data Tunggal dan Data Kelompok Matematika Wajib Kelas 12

Statistika Bagian 7 - Simpangan Baku dan Varian Data Tunggal dan Data Berkelompok
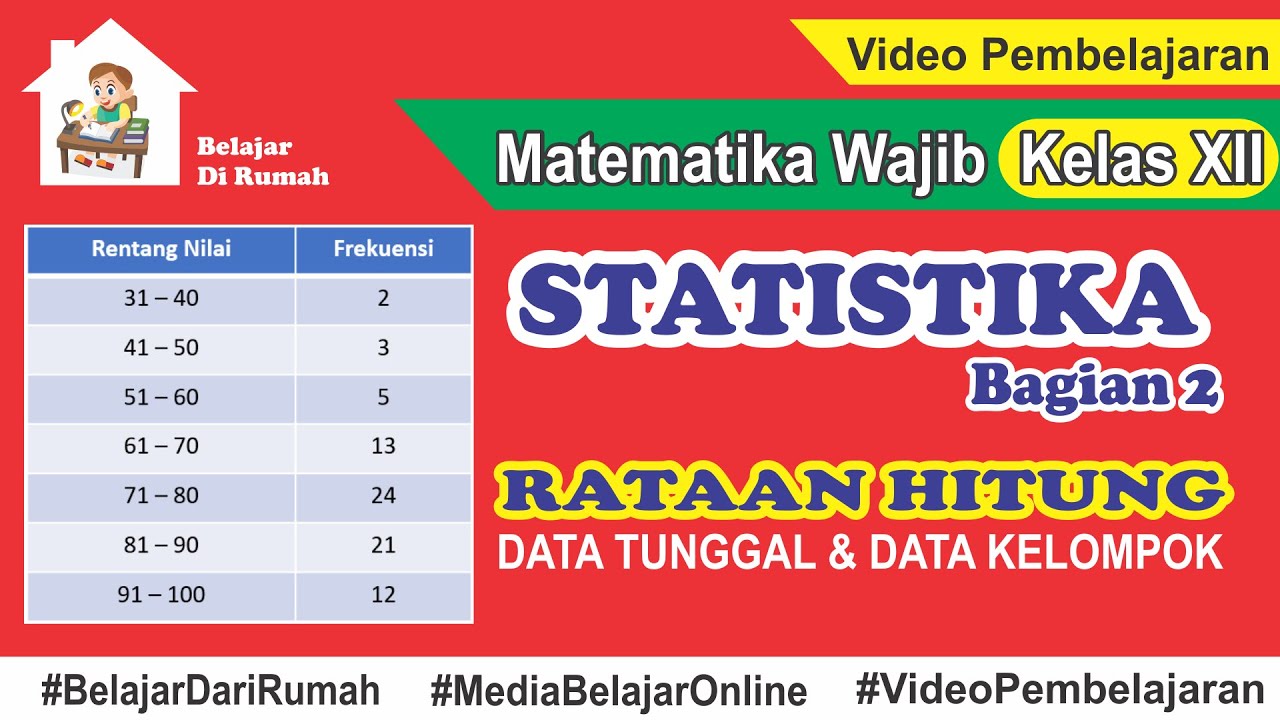
Statistika Bagian 2 - Menghitung Mean Data Tunggal dan Data Kelompok Matematika Wajib Kelas 12

STATISTIKA PART 4 (MEAN, MEDIAN, MODUS)

Statistika Bagian 4 - Median dan Kuartil Data Tunggal dan Data Kelompok Matematika Wajib Kelas 12

STATISTIKA Part 2- Jangkauan, Kuartil dan Jangkauan interkuartil
5.0 / 5 (0 votes)
