Supply and Demand
Summary
TLDRThis video script explores the fundamental concepts of supply and demand, explaining how prices are determined in markets. It covers the relationship between consumers' willingness to buy and producers' willingness to sell, emphasizing the law of demand and law of supply. The script introduces key economic variables like the substitution and income effects, showing how price changes influence consumer behavior. It also discusses how supply and demand curves intersect at equilibrium, shaping the price of goods and services. The dynamic nature of these shifts is highlighted, demonstrating how market prices adjust over time.
Takeaways
- 😀 Goods and services are defined based on specialization, making it easier to purchase things we need rather than produce them ourselves.
- 😀 The price of a good or service is determined by supply and demand, which refers to the amount available and what consumers are willing to pay.
- 😀 Demand is the relationship between the quantity of goods or services consumers desire and the price they are willing to pay.
- 😀 The law of demand states that when prices decrease, consumers are more likely to buy more, and when prices rise, demand decreases.
- 😀 Consumer decisions to buy depend on both the price and their ability to afford the product or service.
- 😀 The substitution effect occurs when consumers choose alternatives over a more expensive item, such as opting for tacos instead of pizza.
- 😀 The income effect refers to the reduction in consumer spending when prices increase, even if income stays the same.
- 😀 A demand schedule lists the quantity of an item consumers will buy at various prices, illustrating how price affects demand.
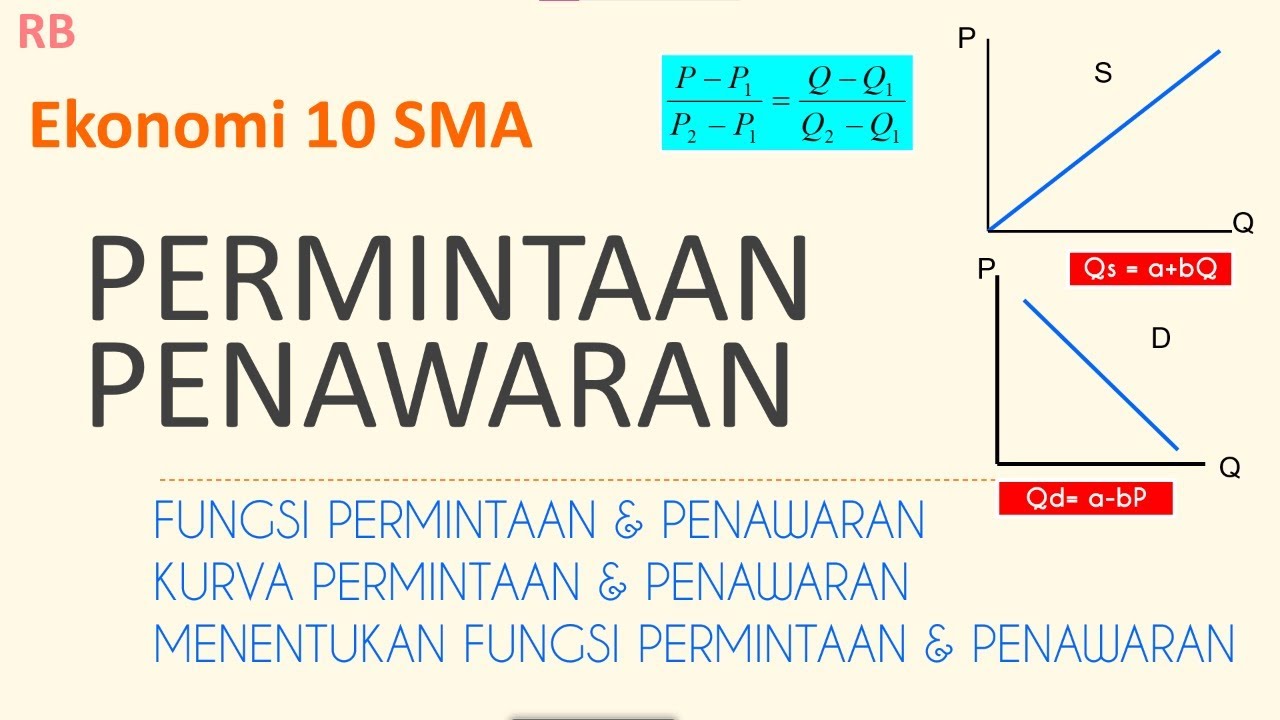
- 😀 A demand curve, plotted from a demand schedule, shows a downward slope, representing the inverse relationship between price and quantity demanded.
- 😀 Supply is the amount of a good or service available, and producers offer more as the price rises and less as it falls, according to the law of supply.
- 😀 A supply schedule lists the quantity of goods that suppliers will offer at different prices, and the supply curve typically slopes upward to show the relationship between price and quantity supplied.
Q & A
What is the relationship between supply and demand?
-Supply and demand are interrelated concepts that help determine the price of goods and services. Supply refers to the amount of a good or service that producers are willing to offer, while demand represents the quantity of goods or services that consumers are willing to buy at different prices. The interaction between supply and demand sets the market equilibrium price.
What is the law of demand?
-The law of demand states that as the price of a good or service decreases, the quantity demanded by consumers increases. Conversely, as the price increases, the quantity demanded decreases, assuming all other factors remain constant.
How does the substitution effect impact demand?
-The substitution effect occurs when consumers respond to a price increase in one good by purchasing more of a similar substitute product. For example, if the price of pizza rises, consumers may buy tacos or hamburgers instead, as they are alternatives.
What is the income effect?
-The income effect refers to the change in the quantity of a good or service that consumers buy when their income remains the same, but the price of the good changes. When prices rise and income stays constant, consumers may buy less of the product because it feels like they have less purchasing power.
What is a demand schedule?
-A demand schedule is a table that shows the quantity of a good or service that a consumer is willing to buy at various prices. It helps visualize the relationship between price and the quantity demanded.
What is a demand curve?
-A demand curve is a graphical representation of a demand schedule. It plots the quantity demanded against price, usually resulting in a downward sloping line, which illustrates the law of demand.
What is the law of supply?
-The law of supply states that as the price of a good or service increases, producers are willing to supply more of that good or service. Conversely, when the price decreases, producers are less willing to supply the good or service.
What is a supply schedule?
-A supply schedule is a table that shows the quantity of a good or service that a producer is willing to sell at various prices. It helps illustrate the relationship between price and quantity supplied.
What is a supply curve?
-A supply curve is a graphical representation of a supply schedule. It plots the quantity supplied against price, generally resulting in an upward sloping line, indicating that as prices rise, suppliers are willing to offer more goods or services.
What is the equilibrium price?
-The equilibrium price is the price at which the quantity of a good or service demanded by consumers equals the quantity supplied by producers. At this price, the market is in balance, with no surplus or shortage of the product.
Outlines

このセクションは有料ユーザー限定です。 アクセスするには、アップグレードをお願いします。
今すぐアップグレードMindmap

このセクションは有料ユーザー限定です。 アクセスするには、アップグレードをお願いします。
今すぐアップグレードKeywords

このセクションは有料ユーザー限定です。 アクセスするには、アップグレードをお願いします。
今すぐアップグレードHighlights

このセクションは有料ユーザー限定です。 アクセスするには、アップグレードをお願いします。
今すぐアップグレードTranscripts

このセクションは有料ユーザー限定です。 アクセスするには、アップグレードをお願いします。
今すぐアップグレード関連動画をさらに表示

La LEY de OFERTA Y DEMANDA | En 5 minutos
PERMINTAN DAN PENAWARAN | HUKUM PERMINTAAN | HUKUM PENAWARAN | FUNGSI PERMINTAAN DAN PENAWARAN

17 Mei 2025

EconMovies #4: Indiana Jones (Reupload)

Supply, Demand, and Market Equilibrium - Mikroekonomi #EP101

Teori Permintaan di Pasar Tenaga Kerja (Demand in Labour Market) - EKONOMI
5.0 / 5 (0 votes)
