ICT Mentorship Core Content - Month 05 - Using 10 Year Notes In HTF Analysis
Summary
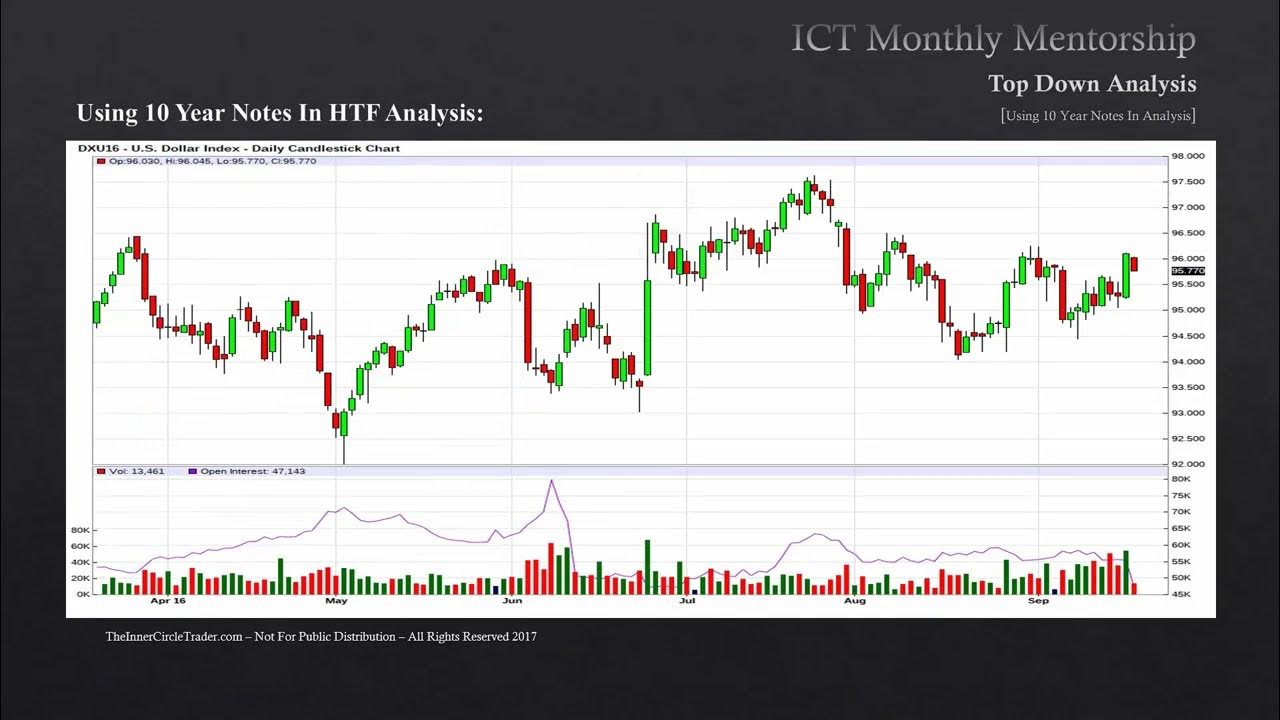
TLDRIn this lesson from the January 2017 ICT Mentorship, the focus is on analyzing 10-year Treasury notes and their yields using higher time frame and seasonal tendency analysis. The session explains how Treasury prices and yields are inversely related, and how these movements impact the Dollar Index. Key seasonal patterns are highlighted, such as highs in January-February and lows in June-July, with practical examples showing when markets trend or consolidate. The lesson emphasizes identifying periods for long-term trends versus short-term trades, demonstrating how tracking Treasury notes and the Dollar Index together can guide more strategic currency and investment decisions.
Takeaways
- 😀 Treasury prices and yields have an inverse relationship: when Treasury prices rise, yields decrease, and vice versa.
- 😀 Seasonal tendencies in 10-year Treasury notes include a high in January–February, a low in June–July, and a rally into December.
- 😀 A declining Treasury price (and increasing yield) correlates with a stronger U.S. Dollar, while a rising Treasury price (and decreasing yield) tends to weaken the Dollar.
- 😀 If Treasury notes and the Dollar Index move in tandem, the market is likely in a consolidation phase, making trend-following trades less viable.
- 😀 When Treasury notes and the Dollar Index move in opposite directions, there is a high probability of a trending market.
- 😀 The mid-year period (May–July) tends to be a low point for 10-year Treasury notes and a high point for the Dollar Index, signaling a range-bound market phase.
- 😀 Strong long-term trends occur when 10-year Treasury notes follow their seasonal tendencies while the Dollar Index moves oppositely.
- 😀 The Brexit vote and election results can disrupt seasonal tendencies, leading to short-term volatility and potential changes in trends.
- 😀 Foreign currencies, like the British Pound or Euro, typically experience consolidation when both Treasury notes and the Dollar Index are range-bound.
- 😀 Key indicators for explosive trades include the alignment of seasonal trends in both Treasury notes and the Dollar Index, signaling a potential long-term trend.
- 😀 Short-term trades are favored when Treasury and Dollar Index seasonal tendencies are not aligned, leading to market consolidation.
Q & A
What is the main focus of Lesson 2.1 of the January 2017 ICT Mentorship?
-The main focus of this lesson is the use of 10-year Treasury yields in higher time frame analysis, particularly examining seasonal tendencies and their impact on the 10-year Treasury notes and the Dollar Index.
What is the typical seasonal tendency for 10-year Treasury notes?
-The typical seasonal tendency for 10-year Treasury notes shows a high around January to February, followed by a drop to a low in June, and then a rally towards December's highs. The first half of the year tends to be bearish, while the second half is bullish.
How are Treasury prices and yields related?
-Treasury prices and yields are inversely related. As Treasury prices drop, yields increase, and as Treasury prices rise, yields decline.
What impact does the movement of 10-year Treasury notes have on the Dollar Index?
-When 10-year Treasury notes are rallying (prices increasing, yields decreasing), the Dollar Index tends to decline. Conversely, when Treasury yields rise, the Dollar Index tends to rally.
Why is the relationship between 10-year Treasury notes and the Dollar Index important for traders?
-This relationship is crucial because it helps traders predict market movements. A rally in Treasury notes often signals a drop in interest rates, which can make the dollar less attractive, while a decline in Treasury notes usually signals rising interest rates, which can boost the dollar.
What should traders focus on when both 10-year Treasury notes and the Dollar Index are in a consolidation phase?
-When both markets are consolidating, traders should focus on short-term trades and look for violations of previous highs and lows, as the markets are less likely to trend in a specific direction.
How does the seasonal tendency of the Dollar Index compare to that of 10-year Treasury notes?
-The seasonal tendency of the Dollar Index is somewhat opposite to that of 10-year Treasury notes. While Treasury notes tend to rally in the second half of the year (after June/July), the Dollar Index typically rallies early in the year, with a decline expected around June/July.
What happens when the 10-year Treasury notes and the Dollar Index move in the same direction?
-When both markets move in the same direction, it suggests a period of large consolidation, making it difficult to predict a clear directional trend. Traders may focus on range-bound trading during this time.
What is the significance of the 10-year Treasury notes' seasonal tendency in June/July for traders?
-The seasonal tendency for 10-year Treasury notes to form a low around June/July is important for traders as it often signals a bullish trend for the second half of the year. However, if this seasonal tendency is absent, traders may adopt a bearish outlook instead.
How did the 2016 U.S. Presidential Election impact the 10-year Treasury notes and the Dollar Index?
-The election results, with Donald Trump becoming President, caused a sharp sell-off in the 10-year Treasury notes, increasing interest rates and boosting the Dollar Index. This created a trending environment for the Dollar Index, as the Treasury yields rose.
Outlines

このセクションは有料ユーザー限定です。 アクセスするには、アップグレードをお願いします。
今すぐアップグレードMindmap

このセクションは有料ユーザー限定です。 アクセスするには、アップグレードをお願いします。
今すぐアップグレードKeywords

このセクションは有料ユーザー限定です。 アクセスするには、アップグレードをお願いします。
今すぐアップグレードHighlights

このセクションは有料ユーザー限定です。 アクセスするには、アップグレードをお願いします。
今すぐアップグレードTranscripts

このセクションは有料ユーザー限定です。 アクセスするには、アップグレードをお願いします。
今すぐアップグレード関連動画をさらに表示
ICT Mentorship Core Content - Month 05 - Qualifying Trade Conditions With 10 Year Yields

ICT Mentorship Core Content - Month 05 - Interest Rate Differentials

Best Top Down Trading Strategy Simplified

ICT Higher Timeframe Bias - Explained

ICT Mentorship Core Content - Month 05 - Quarterly Shifts & IPDA Data Ranges

2022 ICT Mentorship Episode 12
5.0 / 5 (0 votes)
