DataVis : Pod 02 Data Storytelling overview
Summary
TLDRIn this lecture, Sarah Waterson introduces the concept of data-driven storytelling, emphasizing its importance in transforming raw data into compelling narratives through visualization. The process involves gathering data, analyzing it, and using tools like Tableau to visualize insights. Waterson highlights the power of visual storytelling for clarity and engagement, stressing how visuals help users understand and remember data more effectively. Real-world examples like Spotify and Uber demonstrate how organizations leverage data to create personalized experiences. The semester will focus on mastering data wrangling, visualization, and storytelling techniques to effectively communicate insights.
Takeaways
- 📊 Data storytelling involves transforming raw data into visual narratives that are easy to understand and act upon.
- 🎨 The process can move from data to visualization to storytelling or vice versa, emphasizing the importance of visualizing and presenting data meaningfully.
- 🔍 Tableau will be the primary tool used to explore and visualize data throughout the course.
- 📖 Storytelling with data allows audiences to derive knowledge, insights, and wisdom, influencing their perspectives or actions.
- 💡 Visual storytelling is effective because people are wired to process visuals faster and remember them better compared to text or audio.
- 📈 A good data story is informed by data analysis, visualization, and narrative, with the story itself emerging from these elements.
- 🧠 Visualizations help in both research and presentation, allowing users to uncover hidden trends and patterns in the data.
- 🎯 Effective data visualizations involve simple design elements like titles, chart labels, and hierarchies to enhance clarity and impact.
- 💼 Companies like Spotify and Uber use data-driven storytelling to engage users, with examples like Spotify Wrapped and Uber's driver dashboards showcasing real-world applications.
- 🚀 The course will guide students through the steps of data collection, analysis, and visualization, ultimately helping them craft compelling data stories.
Q & A
What is the main topic covered in this podcast episode?
-The episode covers the process of going from data to story to visualization and vice versa. It explains how to present data in an engaging way using storytelling and visualization techniques.
Who is Nathan Shadruff, and why is he mentioned?
-Nathan Shadruff is referenced for his process of transforming data into visualization and story. His framework is used as a foundation for understanding how data visualization works in the context of the semester’s subject.
What tool will be used to explore and visualize data in this course?
-Tableau will be used to explore and visualize data in the course. It helps students understand how to present data insights effectively.
What are the key components of a good data story according to the podcast?
-A good data story consists of three components: data analysis, visualizations, and the narrative or storytelling element. These components work together to present data in an engaging and informative manner.
Why is visual storytelling important in data presentation?
-Visual storytelling is important because it makes data easier to understand and more memorable. Since a significant percentage of people are visual learners, using visuals helps them process and retain information more effectively than text alone.
What are the statistics mentioned about visual learning and information retention?
-The podcast mentions that 75% of people are visual learners, 10% remember what they read, 15% remember what they hear, and 75% remember what they see. It also states that people process visuals 60,000 times faster than text.
How does data visualization aid in research, according to the speaker?
-Data visualization helps identify trends and patterns that might not be apparent in raw data. It aids in both presenting findings and in the research process itself, allowing analysts to discover stories within the data.
What are some examples of companies that use data storytelling?
-Examples mentioned include Spotify, with its annual 'Spotify Wrapped' feature, and Uber, which uses dashboards to visualize driver and rider data. These examples illustrate how companies leverage data to create personalized stories and insights.
What is the role of a data visualization expert in the context of this course?
-The role of a data visualization expert is to find the value in data, organize it effectively, and present it as a story that users can understand and react to. This involves planning, effort, and a range of visualization techniques.
What are the benefits of using storytelling principles in data visualization?
-Storytelling principles make data more engaging and understandable. They help guide the audience through the insights, making the information relatable and easier to apply in real-life scenarios.
Outlines

このセクションは有料ユーザー限定です。 アクセスするには、アップグレードをお願いします。
今すぐアップグレードMindmap

このセクションは有料ユーザー限定です。 アクセスするには、アップグレードをお願いします。
今すぐアップグレードKeywords

このセクションは有料ユーザー限定です。 アクセスするには、アップグレードをお願いします。
今すぐアップグレードHighlights

このセクションは有料ユーザー限定です。 アクセスするには、アップグレードをお願いします。
今すぐアップグレードTranscripts

このセクションは有料ユーザー限定です。 アクセスするには、アップグレードをお願いします。
今すぐアップグレード関連動画をさらに表示
Data Visualization Techniques | Data Visualization Techniques and Tools | Data Visualization Trends

PSD - Data Visualization Part.01/02
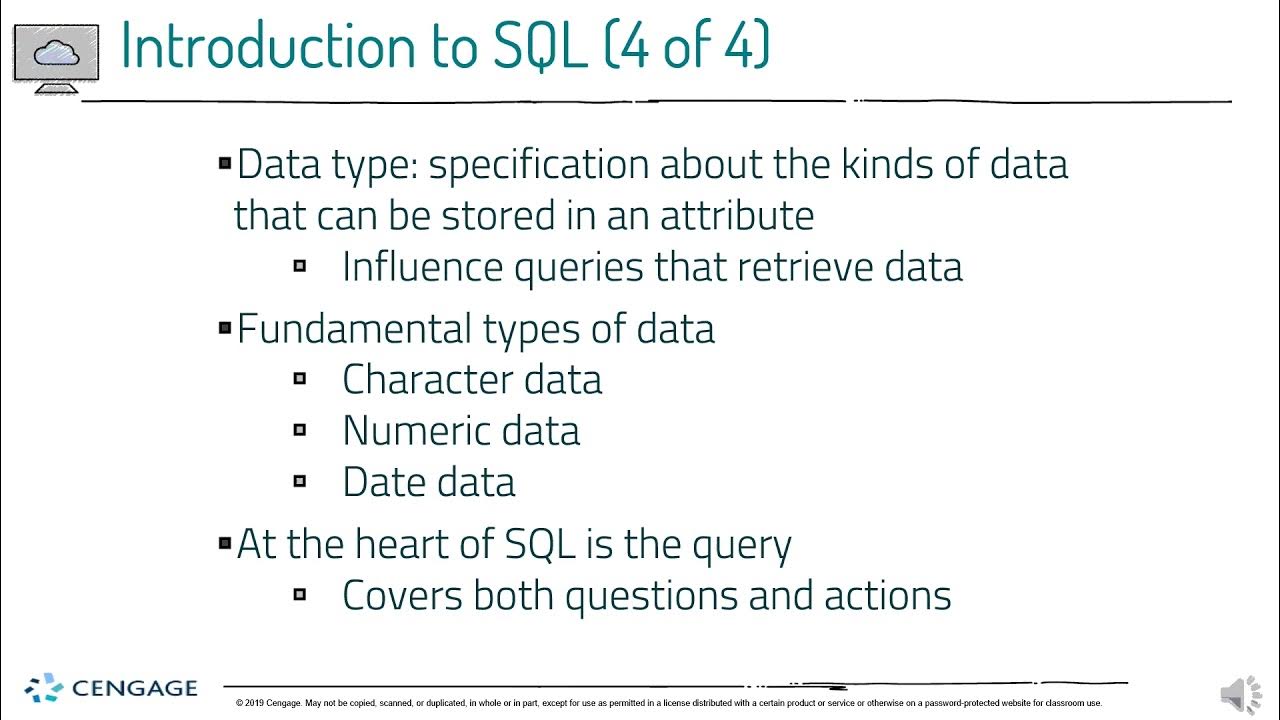
07 Introduction to SQL PART1

Data Mining Foundations Eps-01 Apa itu Data Mining?

Pertemuan 1 - Pengantar Data Mining | Kuliah Online Data Mining 2021 | Data Mining Indonesia
Understanding The Data Life Cycle with DataBrew
5.0 / 5 (0 votes)
