Graphing lines: rule to table to graph
Summary
TLDRThis video script explains how to graph straight lines from a rule (equation) by creating a table of values and plotting points on a graph. It introduces the relationship between variables x and y using real-life examples, such as detention time for being late to class and losing money for incomplete homework. The script guides through constructing tables from equations like y = 3x and y = 10 - x, showing how to plot points and draw straight lines. It emphasizes identifying patterns and interpreting coefficients to understand how variables change.
Takeaways
- 📏 A rule for a straight line is an equation that shows the relationship between X and Y.
- ⏰ For every minute you are late, you get 3 minutes of detention; this relationship is shown as Y = 3X.
- 📊 A table of values helps in visualizing the relationship between X and Y, like a 'what-if' scenario.
- ✏️ To plot points on a graph, use coordinates from the table, e.g., (0,0), (1,3), (2,6), (3,9), and draw a straight line through them.
- 📉 A second example involves losing $1 for every time you don't do your homework, shown as Y = 10 - X.
- 🔢 The number in front of X (like 3 in Y = 3X or -1 in Y = 10 - X) controls how much Y changes when X increases.
- 📐 Always plot your points carefully and extend the line across the graph, labeling it with the rule.
- 📏 A third example introduces the rule Y = 2X - 1, where the constant (-1) starts at the zero point.
- 🔍 Patterns in changes of Y can be identified, such as in Y = 2X - 1, where Y increases by 2 for each increase in X.
- 🚫 When negative values are involved, you can reverse the pattern to continue plotting points in the negative range.
Q & A
What is a rule for a straight line in mathematics?
-A rule for a straight line is an equation that shows the relationship between x and y. In the context of the video, it's used to represent how changes in one variable (x) affect the other variable (y).
In the example of being late to class, how is the detention time calculated?
-The detention time (y) is calculated as 3 times the number of minutes late (x). The rule is expressed as y = 3x.
Why is the variable that depends on the other usually called 'y'?
-In math, the dependent variable is typically represented by 'y' because its value depends on the independent variable, which is represented by 'x'. In this case, the detention time depends on the number of minutes late.
How do you graph the equation y = 3x?
-To graph y = 3x, you first create a table of values for x and calculate the corresponding y values. For example, when x = 0, y = 0; when x = 1, y = 3; and when x = 2, y = 6. Then, you plot these points on a graph and connect them to form a straight line.
What is the rule if you start with $10 and lose $1 for every time you don’t do your homework?
-The rule is y = 10 - x, where x represents the number of times you don’t do your homework, and y represents the amount of money you have left.
How does the y value change in the equation y = 10 - x as x increases?
-As x increases by 1, the y value decreases by 1. This shows a linear relationship where the slope of the line is -1.
What does the number on its own (like 10 in y = 10 - x) represent?
-The number on its own represents the initial value of y when x is 0. In y = 10 - x, 10 is the starting value of y.
How is the equation y = 2x - 1 graphed?
-First, create a table of values for x, such as x = 0, 1, 2, 3. Then calculate the corresponding y values. For example, when x = 0, y = -1; when x = 1, y = 1; and when x = 2, y = 3. Plot these points and draw a line through them.
What is the significance of the number in front of the x in equations like y = 2x - 1?
-The number in front of the x (in this case, 2) represents the slope of the line. It indicates how much y changes for every 1-unit increase in x. In y = 2x - 1, y increases by 2 for every 1-unit increase in x.
What pattern can you observe in the values of y for y = 2x - 1 as x increases?
-As x increases, y increases by 2 each time. This pattern reflects the slope of the line, which is 2 in this case.
Outlines

このセクションは有料ユーザー限定です。 アクセスするには、アップグレードをお願いします。
今すぐアップグレードMindmap

このセクションは有料ユーザー限定です。 アクセスするには、アップグレードをお願いします。
今すぐアップグレードKeywords

このセクションは有料ユーザー限定です。 アクセスするには、アップグレードをお願いします。
今すぐアップグレードHighlights

このセクションは有料ユーザー限定です。 アクセスするには、アップグレードをお願いします。
今すぐアップグレードTranscripts

このセクションは有料ユーザー限定です。 アクセスするには、アップグレードをお願いします。
今すぐアップグレード関連動画をさらに表示
ILLUSTRATING LINEAR EQUATIONS IN TWO VARIABLES || GRADE 8 MATHEMATICS Q1
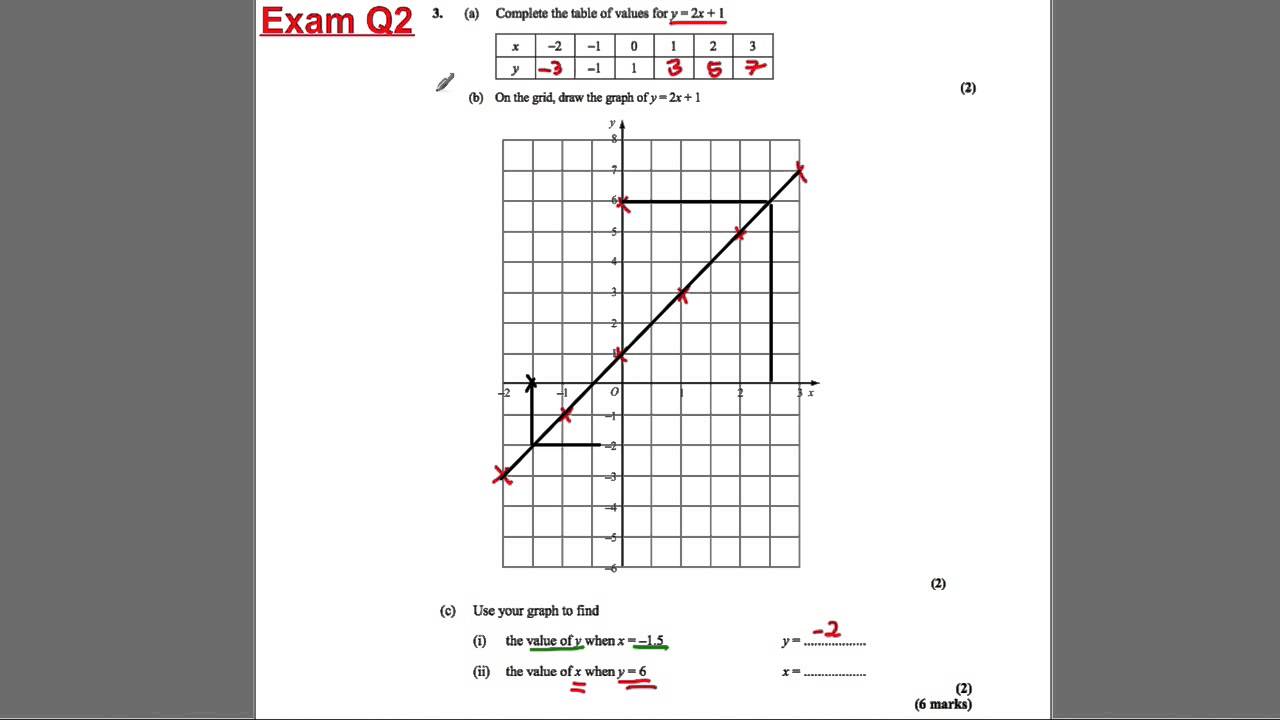
GCSE Revision Video 20 - Straight Line Graphs
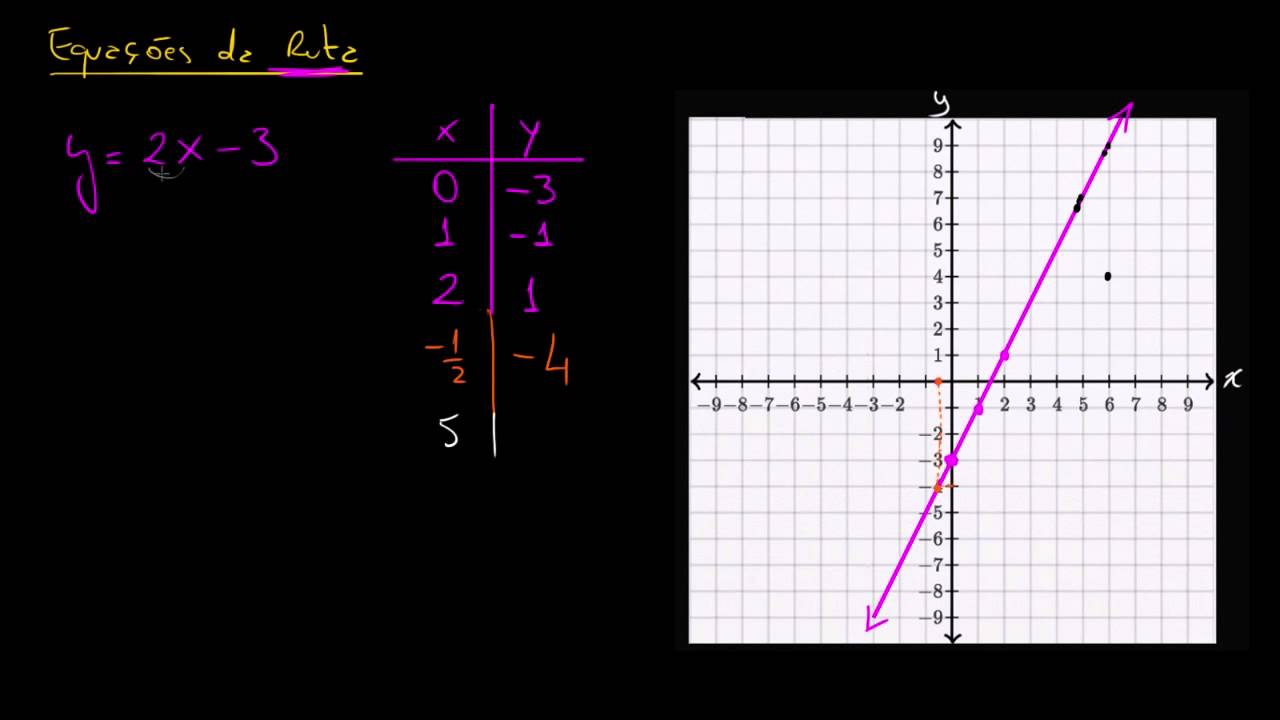
Equações lineares com duas variáveis e seus gráficos
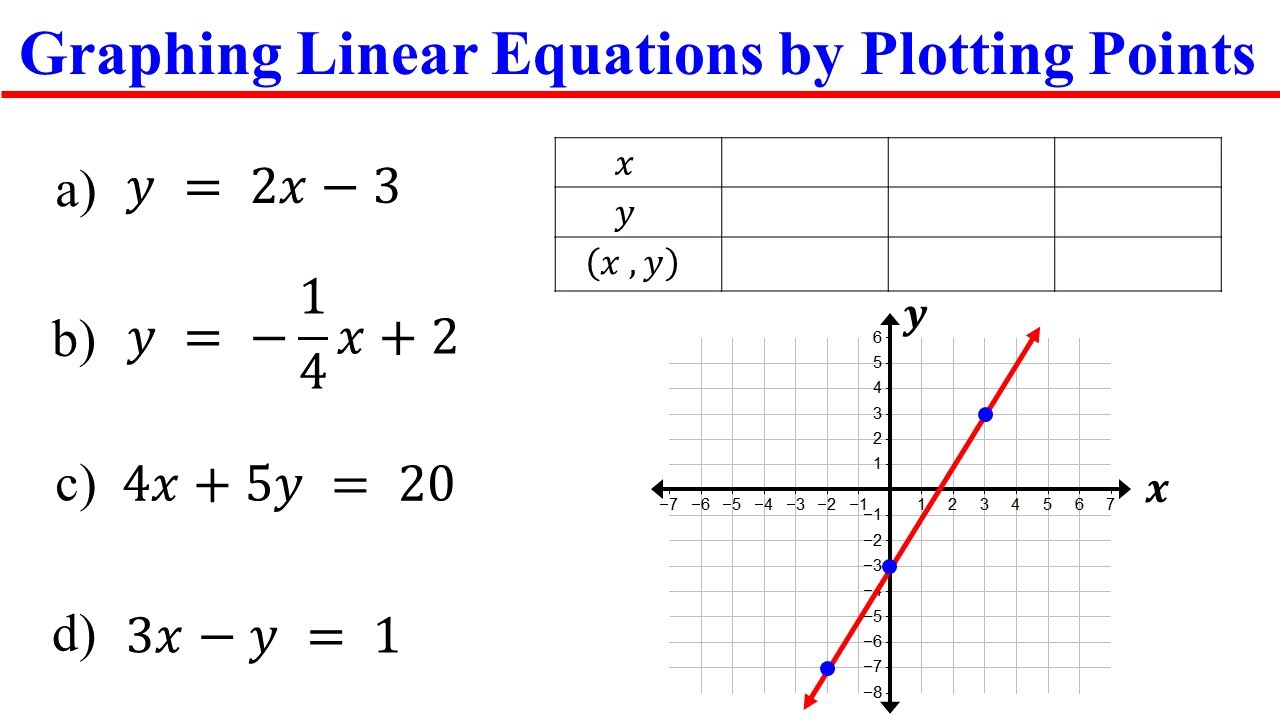
Graphing Linear Equations by Plotting Points (Using a table of values)
Kurikulum Merdeka Matematika Kelas 8 Bab 5 Persamaan Garis Lurus
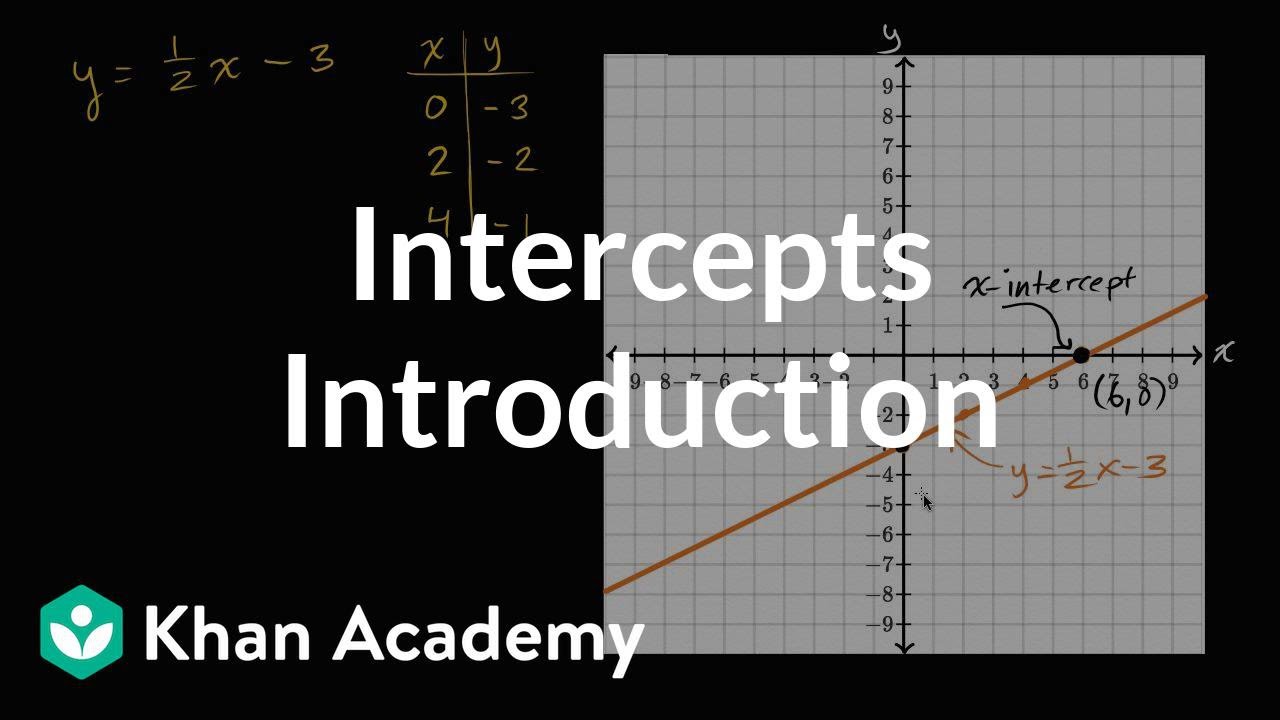
Introduction to intercepts | Algebra I | Khan Academy
5.0 / 5 (0 votes)
