A CLOSE CALL! - Low Level Wind Shear and Stall on Takeoff
Summary
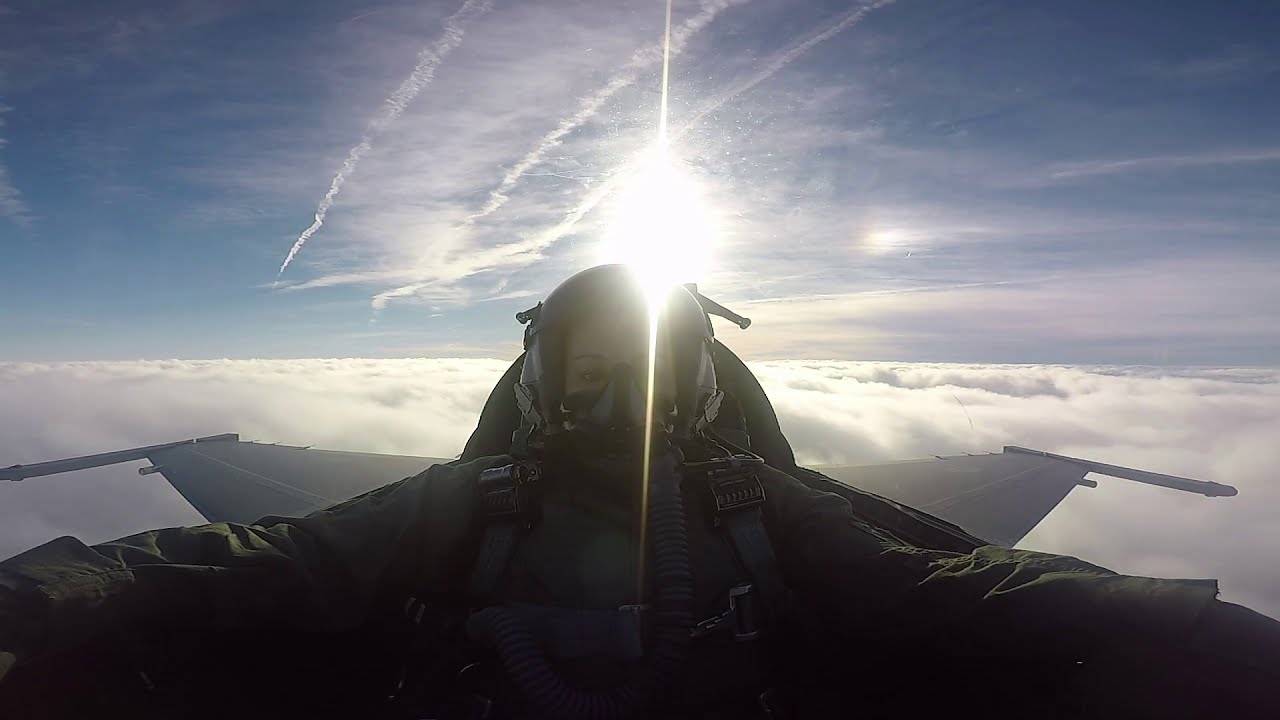
TLDRThe pilot recounts a turbulent flight from Tacoma Narrows Airport to Packwood, Washington, on July 16, 2020. Despite safe landing, takeoff was fraught with wind shear issues and severe turbulence due to mountainous terrain. The video offers a dual perspective analysis, including a point-of-view camera and wing-mounted camera, detailing the stall warnings and fluctuating airspeed. Post-flight analysis covers weight and balance, density altitude calculations, and performance data, emphasizing the perils of valley flying in summer.
Takeaways
- 🛫 The flight took off from Tacoma Narrows Airport to Packwood, Washington, encountering turbulence during landing but managed to land safely.
- 🌬️ Wind shear and turbulence occurred during takeoff due to wind gusts of 27 knots and mountain-induced turbulence near the Packwood area.
- 📸 The pilot recorded the takeoff with a camera mounted on the left wing and a point-of-view camera for detailed flight analysis.
- 🚨 The stall warning horn was triggered multiple times due to sudden airspeed losses caused by wind shear during takeoff, especially near the treetops.
- 🛰️ The flight path was programmed into the ForeFlight app, showing a 77 nautical mile route with an estimated time of 49 minutes and fuel burn of 8.6 gallons.
- 🌄 Packwood Airport is surrounded by mountains, and the winds coming from the southwest created severe turbulence as they funneled through the valley.
- 📈 Windy.com was used for flight planning, showing real-time and forecasted wind speeds. However, it couldn't predict the impact of local terrain features on turbulence.
- ⚖️ Weight and balance data were reviewed, showing the plane was well within its weight limits, but density altitude increased to 2,580 feet, reducing climb performance.
- 🛬 The plane’s climb performance was degraded due to wind shear, with the vertical speed indicator fluctuating between flat to 400 feet per minute before stabilizing.
- 📊 After analyzing the flight, the pilot concluded that taking off at a different time of day with more stable air conditions could have avoided the turbulence issues.
Q & A
When did the pilot experience the flight with turbulence and wind shear?
-The pilot experienced the flight on July 16, 2020.
From which airport did the pilot take off and where was the destination?
-The pilot took off from Tacoma Narrows Airport and the destination was Packwood, Washington.
What kind of weather conditions were reported during the takeoff?
-During the takeoff, the wind gusts were reported at 27 knots and there was a lot of turbulence coming off the mountain and interacting with the trees and other terrain features in the valley.
What was the total flight distance and estimated time for the flight?
-The total flight distance was 77 nautical miles and the estimated time was 49 minutes.
What was the fuel burn estimated for the flight?
-The estimated fuel burn for the flight was 8.6 gallons.
What tools or apps did the pilot use for flight planning and analysis?
-The pilot used apps like Windy.com for weather information and ForeFlight for flight planning, weight and balance data, density altitude calculations, and airplane performance data.
What was the airport's elevation and its impact on the flight?
-The airport's elevation was 1057 feet. The density altitude at the time of takeoff was calculated to be 2580 feet, which significantly affects the climb performance of the airplane.
What was the rate of climb performance of the PA28140 under normal conditions?
-Under normal conditions, the rate of climb performance of the PA28140 was about 700 feet per minute.
What was the pilot's total takeoff weight and center of gravity?
-The pilot's total takeoff weight was 1787 pounds, and the center of gravity was within the acceptable range as indicated by the weight and balance data.
What were the wind conditions like at the time of takeoff according to Windy.com?
-According to Windy.com, the wind velocity on the ground was about 7 to 10 knots, but it showed 27 knot gusts, which is what was experienced just after takeoff.
What was the pilot's conclusion about the flight and what would they do differently next time?
-The pilot learned a great deal from the flight and concluded that they would not take the flight under similar conditions. They would choose a more stable time of day like early morning or a time of year with more stable air, avoiding summer midday flights.
Outlines
🛫 Turbulent Takeoff Experience
The pilot recounts a turbulent takeoff from Tacoma Narrows Airport to Packwood, Washington, on July 16, 2020. Despite experiencing significant turbulence and wind shear, the flight landed safely. The video includes an analysis of the takeoff with footage from a camera mounted under the left wing and a point-of-view camera on the pilot. The wind gusts were reported at 27 knots, causing severe turbulence due to the interaction with the mountainous terrain and trees in the valley. The pilot also discusses the flight route, distance, estimated time, and fuel burn, as well as a post-flight analysis covering weight and balance data, density altitude calculations, and airplane performance data.
🌬️ Analyzing Wind Shear with Windy.com
The pilot discusses the use of the Windy.com app for flight planning, especially for airports without a weather station. The app provides real-time wind velocity and direction data from various weather stations. The pilot uses the app to analyze the wind conditions during the flight, which were characterized by 27-knot gusts causing wind shear due to the surrounding terrain. The pilot explains how these conditions affected the climb out after takeoff, leading to a fluctuating airspeed and multiple stall warnings. The app is also praised for its weather prediction features and its ability to provide information from nearby weather stations.
📊 Weight and Balance Considerations
The pilot reviews the weight and balance data of the airplane, which is crucial for flight planning. The data includes the pilot's weight, fuel, flight bag, and baggage, resulting in a total takeoff weight of 1787 pounds with a center of gravity within the safe envelope. The pilot uses the 'in flight' app to calculate this data and compares it with an external weight and balance calculator, finding them to be consistent. The pilot also discusses the importance of considering density altitude during flight planning, which affects the airplane's climb performance. The density altitude at the time of takeoff was found to be significantly higher than the airport's elevation, which was crucial for understanding the airplane's performance.
📈 Climb Performance and Wind Shear Impact
The pilot examines the airplane's climb performance using a rate of climb chart for the PA28140, considering the airplane's loaded weight and the density altitude at the time of takeoff. The expected climb rate was around 700 feet per minute, but the wind shear conditions significantly affected this performance. The pilot uses track lock data from the 'for flight' app to illustrate the impact of wind shear on the climb out, with the airplane initially struggling to maintain altitude and experiencing periods of no climb or even a loss of altitude. The pilot also discusses the airplane's airspeed and vertical speed indicators during the takeoff, highlighting the moments when the stall warning activated and how the climb performance normalized after reaching about 500 feet above ground level.
🚀 Recovering from Wind Shear and Updrafts
The pilot describes the airplane's recovery from wind shear and the subsequent encounter with updrafts. After experiencing a significant wind gust that triggered a stall warning, the pilot chose not to pitch down to recover airspeed but instead leveled the nose to regain airspeed and resumed a normal climb. The vertical speed indicator showed fluctuations from zero to over 1500 feet per minute, indicating the extreme turbulence. The pilot emphasizes the importance of maintaining airspeed in such conditions and not relying solely on pitch changes to recover from stalls. The video analysis helped the pilot understand the need for caution during takeoffs in turbulent conditions and the importance of being prepared for rapid changes in wind direction and speed.
📚 Lessons Learned from the Flight
The pilot reflects on the lessons learned from the flight, emphasizing the value of video analysis in understanding the dynamics of wind shear and turbulence. The experience prompted further research into weight and balance data, density altitude, and their effects on climb performance. The pilot concludes that the best course of action for future flights would be to avoid flying during times of unstable air, such as midday in the summer, and instead choose more stable times like early morning or different seasons. The pilot expresses gratitude for the learning experience and hopes to apply these lessons to future flights, ensuring safer operations.
Mindmap
Keywords
💡Turbulence
💡Wind Shear
💡Stall Warning Horn
💡Density Altitude
💡Valley Flying
💡Takeoff Performance
💡Weight and Balance
💡POV Camera
💡Windy.com
💡Rate of Climb
💡Terrain Features
Highlights
Pilot experienced severe turbulence and wind shear during takeoff from Packwood, Washington.
The pilot had a camera mounted under the left wing and a point of view camera on himself for dual perspective analysis.
Stall warning horn activated multiple times during the critical phase of takeoff.
Wind gusts in the area were reported at 27 knots, causing significant turbulence.
The most dangerous takeoff the pilot had ever experienced due to severe turbulence and wind interaction with terrain.
Pilot analyzed weight and balance data, density altitude calculations, and airplane performance data post-flight.
The pilot used an app called windy.com for pre-flight planning and weather analysis.
Windy.com provided real-time wind velocity and direction data from numerous weather reporting stations.
The pilot discussed the importance of considering density altitude when planning flights, especially in mountainous regions.
A detailed weight and balance analysis was performed using the in-flight app, revealing the plane was well within operational limits.
Pilot demonstrated how to use the weight and balance calculator within the in-flight app.
Track lock data from the flight was used to analyze the plane's climb performance and the effects of wind shear.
The pilot discussed the airplane's stall speed and how close they got to it during the turbulent takeoff.
A 3D replay of the flight from the in-flight app showed the altitude and ground speed during the critical takeoff phase.
Pilot learned the importance of selecting more stable air times for flights in valleys to avoid dangerous turbulence.
The pilot concluded that he wouldn't have taken the flight given the knowledge of valley flying dynamics he gained.
Transcripts
yesterday july 16 2020 i took a flight
from tacoma narrows airport to packwood
washington
and on landing i experienced a lot of
turbulence we got down on the ground
safely and shortly thereafter we took
off and that's where we experienced our
wind shear issues this video
includes a lot of analysis but it starts
with
simply with the takeoff so you'll just
see in real time
what we experienced on takeoff i had a
camera mounted under the
left wing and also had a point of view
camera mounted on me the pilot
so you get to see it from both
perspectives you're going to hear the
stall warning horn come on
a couple of times during takeoff very
close to the treetops
the wind gusts in the area were reported
at 27
knots and there was a lot of turbulence
coming
with the winds coming off the mountain
and interacting with
the trees and other terrain features in
the valley
so it made for the most dangerous
takeoff that i've ever experienced
if you're interested in seeing the
post-flight analysis that i did which
would include weight and balance data
density altitude calculations and
airplane performance
data and then i'll reshow the video and
stop it at certain points and talk about
what was going on with the airspeed and
the vertical speed indicator
and where and why we were experiencing
stalls
so if you want to see that portion stick
around if not you can just watch the
take off itself
and see what was happening with the
airplane as we barely made it above the
treetops
this is the route of flight that i
programmed into four flight departing
packwood arriving tacoma narrows
the total flight distance is 77 nautical
miles
estimated time 49 minutes and fuel burn
8.6 gallons
let's zoom in on packwood and take a
look at some of the surrounding terrain
as you can see it sits in a valley
surrounded by mountains
on this side to the west 5442
southeast 5980 to the east 6754
so it's completely surrounded by
mountains the winds yesterday were
coming from this direction
from the south west and then as they
come
over this mountain right here sky
mountain they
come down into the valley causing severe
turbulence
in the trees and other features down
here in the valley around the airport
[Applause]
okay pov cam on check check check
feet and speak valves trim
setting neutral that
flight controls right aileron left
aileron
elevator flight controls free and
correct directional gyro re-checking
going 2-9 or 0-2-9 or zero set
artificial horizon
that altimeter set to field elevation
fuel quantity
the efficient and balanced
primer is in and lock mixture full rich
and 1800 rpm
[Music]
good drop back to both rp check
light drop scene oil pressure fuel
pressure oil temperature
ferro suction gauge in the green and
pecking title
going rpms back to 1000
ammeter check with load new pump and
landing light on
transponder squawk altitude
radios and avionics on its debt
for flight
landing light is on strobe rotating
beacon on flap set for takeoff cabin
door
latch tops bottoms window secure
selector timer is on
and switching thanks
right tank set
time is noted
[Applause]
ipad graphite connection and we are
connected
backward traffic cherokee 7428 romeo
taking off runway 1-9
straight out departure backward traffic
okay we have a slight crosswind the left
variable
to hold the flight controls to the left
okay feet off the brakes full power
engine instruments in the green power
available
for takeoff airspeed indicator is alive
looking for 75.
up on 70. off the ground
[Music]
me
[Music]
so
here's an app i find extremely useful
for flight planning purposes
especially when there's an airport that
does not have a weather station
on the airport itself this is an app
called
windy.com up here in the search bar
i'm going to go ahead and type in
packwood which is the airport that we
departed from
in lewis county and we're going to go
ahead and click on that and as you can
see it shows the wind velocity and
direction
and it's gathering its information from
numerous weather reporting stations in
the region
now this isn't the conditions as they
existed yesterday when i took off
this is current conditions this is a day
later so the
speeds and directions aren't necessarily
going to be relevant
let's go ahead and zoom in on the
airport itself
and as you can see it's showing the
direction of the wind and it's
pretty similar to the direction
yesterday it was coming over sky
mountain
and cougar rocks right here and then
coming down into the valley here
and just above the treetops it was
swirling around
on the ground itself it was seven to ten
knots
from variable from about two zero zero
to one seven
zero which favored runway one nine that
was great
the problem started when as soon as the
airplane got above the treetops
and all that swirl started to happen
windy.com
yesterday around the time of takeoff
reported the wind velocity
again on the ground about 7 to 10 knots
but it showed 27 knot gusts
and that was what we experienced just
after takeoff
now that would be fine if the wind gusts
were generally coming from our direction
into our direction of flight
but unfortunately that wasn't the case
the wind was swirling around and so
what would happen is on climb out that
wind would come in behind the airplane
essentially wind shear caused by the
surrounding terrain
and now all of a sudden you would go
from a fairly steady
air speed of 85 and then you would have
this 25 knot gus come in behind you
and it would shear 25 knots off your air
speed
and which place the airplane into
its stall speed and that's why you were
hearing the stall warning horn and the
stall warning light was coming on
on climb out and that fluctuated several
times
pretty much above the treetops until we
got about five or six hundred feet agl
so those were the conditions we
experienced
i highly recommend windy.com especially
again
when flying into an airport that doesn't
have a on station weather
and especially if you're flying in the
mountains
one of the cool things about the app if
you look down here at the bottom
it also gives you a prediction of
weather and wind speed and direction
throughout the day going on into the
next two days
current conditions are indicated right
here
and as we can see right now the wind
gusts are already
around 17 knots as we get
more toward the middle of the day you
can see it picks up to 26
27 knots and that's what we're
experiencing yesterday
right about here 27 knot winds and if
you're interested to know
where it's getting its information from
in terms of weather you click right here
the nearest weather stations and when
you click on that you can see
it brings up a number of weather
stations including right in the town
itself
so this is a fantastic planning tool
wendy.com and that's what we used
yesterday
but unfortunately you can't predict
what the winds are going to be doing as
it interacts
with trees and other terrain features in
and around the airport
that's where we experienced our wind
shear yesterday
another thing i'd like to take a look at
in for flight if you go down here where
it says
more and click on weight and balance
right here
now this is bringing up the performance
profile of the airplane that i have
programmed into it you can program in
any number of airplanes and you put in
its performance profile
enter in the information that's relevant
to your flight right here and it'll give
you your weight and balance
data so yesterday i
it's just me on board 190 pounds
no co-pilot had 36 gallons of fuel
in the passenger seat i had my flight
bag i estimate that at 10 pounds and
then in the baggage area i had about 20
pounds
that's just a maintenance kit and some
other stuff that i have in there
and it shows your total takeoff weight
which is 1787 right here
and uh it gives your center of gravity
loaded as you see it right here
and as you can see we're well within the
the center of gravity
um envelope and i'm going to go ahead
and bring up here
the weight and balance calculator that i
also use
and all the data here matches exactly
what for flight does so that's a really
fantastic tool
in for flight that i uh refer to
every time i load the airplane for a
flight
in addition to the weight and balance
data for the airplane in terms of climb
performance we also have to consider the
density altitude at the time of takeoff
now when planning a flight you can
always go to four flight bring up the
airport
click on weather and then as you scroll
down here it shows you the density
altitude
right here in in this case at this
moment
it's 273 feet but since i had to do a
look back at what the conditions were
yesterday
i brought up this information on the
internet so this is a terminal area
forecast for yesterday july 16
21 35 zulu which is the time we took off
this is the nearest airport kilopapa
lima
uniform which is thunfield in pierce
county washington
so at the time of time of takeoff we
were showing a barometric pressure of
30.02 in inches of mercury
and the temperature dew point spread was
26 16
celsius then i went ahead and entered
that data
into this calculator so we have a field
elevation
at the airport in packwood of 1057 feet
air temperature 25 celsius altimeter
setting 3002 in inches of mercury
and dew point in celsius is 16. when we
click calculate
we see that the density altitude of the
airport is actually 2580 feet
that's what the airplane sees based on
all of the conditions
whereas the elevation the airport is one
thousand fifty seven
so we see we have about a fifteen
hundred foot difference
which also affects the climb performance
of the airplane
now that we know the density altitude of
the airport we can take a look at a rate
of climb chart for the pa28140
this is based on two different weights
1950 and 2150
the loaded weight of the airplane as we
saw earlier is
rounded up to 1800 pounds so we're going
to go with the 1950 pound which is the
solid line
the density altitude the airport is
rounded up to 2600 feet so that puts us
about right here at 2600
and we take that all the way across to
the solid line
and we show about a 700 foot per minute
climb performance
again given the weight of the airplane
and the density altitude at the airport
at the time of takeoff
which is normally a good rate of climb
but factor in the wind shear conditions
that we experienced
and you saw the results of that and
we'll take a little bit of a closer look
what you're seeing here is track lock
data from yesterday's flight taken from
for flight and we're going to go ahead
and play this
in 3d the things to pay attention to
here are our altitude
in msl and then our ground speed
unfortunately there's no way for
for flight to portray airspeed keep in
mind that
there were some strong headwinds and so
the ground speed
at times is going to show a low number
but
this will show how the climb out
performance was affected by the wind
shear
so pay particular attention here to the
altitude as we climb
out this is being played at normal speed
this is our take off roll
as you see the ground speed increasing
1057 is the altitude of the airport
so you'll see just when we left the
ground right there
the climb out was decent initially we
got just barely above the tree level and
then we experienced the stall warning
horn
which was clearly evidence of a wind
shear or wind gusts coming from behind
the airplane
and the climate performance was greatly
degraded as you'll see in the video
we'll zero in on the
air speed indicator and the vertical
speed indicator there were times when
the climate was nearly flat
to maintain a v y climb
then all of a sudden when we got about
roughly 500 feet hel
the climb out normalized the wind gusts
subsided and it was a fairly normal
climb out after that in fact i
experienced this
strong updraft after getting above about
500 agl where the airplane was climbing
better than the thousand feet per minute
i maintain a stall speed table in the
for flight checklist
so if we click on more and go to
checklist we'll see that for this
airplane with zero degrees
bank angle and no flaps the stall speed
is 64 miles per hour
this is based on a fully loaded airplane
of 2150 pounds
below this airspeed the airplane is
unable to maintain lift
here we are lined up on runway one nine
getting ready to take off
under normal circumstances given the
weight and balance data for the airplane
and the density altitude for the airport
we would expect a rate of climb of about
700 feet per minute as you'll see
just as we get above the treetops that
climb performance greatly degrades
and a couple of times we experience the
stall warning
we're going to freeze the video a couple
of times and we'll look at the
vertical speed indicator the air speed
indicator and talk about what was going
on at those various times
during takeoff full power
mention instruments in the green power
available for
takeoff airspeed indicator is alive
looking for 75. everything's normal up
to this point
as soon as the we get off the ground
though you'll see a strong wind gust
push us
way off center line so i'm correcting
for that now
okay right there you hear the stall
warning horn
it gives just a really quick blip now i
want to go back a few frames just to see
what was going on there
so right now i'm going back i want to
see what's happening with that airspeed
indicator
why did that happen and i'm not really
sure because i'm not seeing the air
speed degrade
to the point where it should have gone
into a stall
so we're going back we're going back a
few frames
i see it probably right around 70.
so i'm not really seeing anything that
would give me an indication of why that
came on
nonetheless though it did come on so at
least for a very brief moment that wing
lost lift let's go ahead and resume the
video
i was definitely a little concerned when
i heard that and very focused on what
was going on
so let's take a look at the vertical
speed indicator so normally right here
we're at a vy climb speed of 85
we should be expecting about 700 feet
per minute
but we're barely seeing one maybe 200
feet per minute on climb
out and as you can see there's some
pretty tall trees just ahead of us
see the airspeed indicator is very
erratic right there
we get a full-blown stall warning all
right so let's go back a few frames and
see what was happening
with the airspeed so here we're going
back
we were at a normal v y climb of 85
and then it went down to about 62
miles per hour and that happened in less
than one second
so we had about a 20 mile per hour swing
in airspeed in less than one second
and so we went from a normal vy climb of
85
to below stall speed in the clean
configuration
and so you can see how that triggered
the stall warning light
and horn and i knew that i didn't have a
lot of altitude to play with
so instead of pitching down to recover
that air speed
i just leveled the nose let it regain
air speed
and then resumed a v y climb at 85.
so they were back at a normal v y so
again
the if you look at the the the speed we
have here it is fluctuating
probably between somewhere between 75
and 90.
again that's due to the wind gusts
but the vertical speed indicator is
going from zero to
maybe 400 there's zero
so we're flat
so it went from flat to about five or
six hundred feet per minute
and these tree tops are not very
far below us here we might have 50 feet
above those treetops and that obviously
had me concerned
see that vsi it goes flat it goes up to
about 400 feet per minute
and right about here you see we're
getting kicked all over the place
but right about here when we got to
about 500
now look at the vertical speed indicator
we're about
400 agl right here maybe 450 agl
the vertical speed indicator goes from
flat to about three maybe four hundred
feet per minute
all the way up to above a thousand feet
per minute all in a couple of seconds
and right there you'll see it goes to
fifteen hundred feet
per minute now i didn't change the pitch
attitude of the airplane at all
so clearly what we were experiencing
before
was a down draft and now we're
experiencing a significant updraft
so again no change in pitch attitude and
we went from a vy climb of 85
up to 100 and 1500 feet per minute
in rate of climb
so there at vy we're at 1500 feet per
minute right now on climb out
now it's going back down to a thousand
now we're going to see it normalize
as we get out of that mechanical
turbulence so there's about what we
expected 700 feet per minute
is a normal climb out at vy speed right
here of 85
full power engine instruments in the
green
power available for takeoff
airspeed indicator is alive
looking for 75.
up on 70 and off the ground
[Music]
me
so
[Music]
so in conclusion what did i learn and
what would i do different next time
well i learned a great deal this flight
allowed me to analyze some video footage
from both the pov camera and a wing
mounted camera
the pov camera was able to see the
instruments i was able to associate what
i was seeing there
with the stall warning horn and when
that occurred
and so it was an invaluable experience
for me it also caused me to
go back and do some research on weight
and balance data
and density altitude and the effects
that those are going to have on client
performance
and i was able to put all of that stuff
together and learn a great deal
the simple answer to uh what i would do
different
is i wouldn't take the flight now that i
understand
the dynamics of valley flying and
the summertime temperatures and winds
and the effect of those winds
accelerating over the mountains down
into the valleys and the turbulence that
they cause when they interact with
terrain features
and trees and that sort of thing i would
select the time of day when the air is
more
stable like early morning or a time of
year when you typically experience
more stable air and do the flight then
instead of a summer
midday flight it's one thing to look at
the weather
and see wind direction and speed it's
another to experience
the types of turbulence that i
experienced on this flight
and as you saw from the video there were
times when the airplane was not only not
climbing it was losing altitude
and at times even dipping below its
stall speed while trying to clear
trees at the other end of the runway
so i hope that you were able to learn as
much as i
learned from this experience i
appreciate you joining me and i hope to
see you again next flight
[Music]
do
[Music]
do
[Music]
[Music]
do
[Music]
so
[Music]
oh
[Music]
[Music]
you
関連動画をさらに表示
Relative Motion Review— Sine and Cosine Law Solution
Principios de Peso y Balance (Parte 2) - Balance y CG
ATPL Meteorology - Class 13: Turbulence and Windshear.
Mavic 3 Thermal Raptor Maps Solar Inspection Flight Planning for Standard Inspections (DJI M3T)
Icing may have contributed to airplane crash in Brazil, analysts say
Unforgivable!! The Tragic tale of Air Algérie Flight 6289
5.0 / 5 (0 votes)