LaiXinHong (s4042341) BUSM2562 Assessment 3 - Presentation and networking event
Summary
TLDRThis presentation discusses the effects of consumption taxes and tariffs on public health, economic growth, and government revenue. It explains how taxes alter consumer and producer welfare, create deadweight loss, and impact aggregate demand and supply. The potential benefits of a 'fat tax' for long-term economic growth are highlighted, using Directed Acyclic Graphs to illustrate its influence on health outcomes and economic performance.
Takeaways
- 📊 Consumption taxes reduce consumer and producer welfare by shifting the supply curve and decreasing overall market activity.
- 💸 Taxes cause a deadweight loss, which reflects a reduction in economic welfare due to decreased transactions.
- 🏛️ The government collects tax revenue from consumption taxes, which can be used for public services and programs.
- 📉 Tariffs on imports raise import prices, reducing consumer surplus while benefiting domestic producers with higher prices and producer surplus.
- ⚖️ Deadweight loss from tariffs comes from reduced international trade, while for consumption taxes, it stems from decreased domestic transactions.
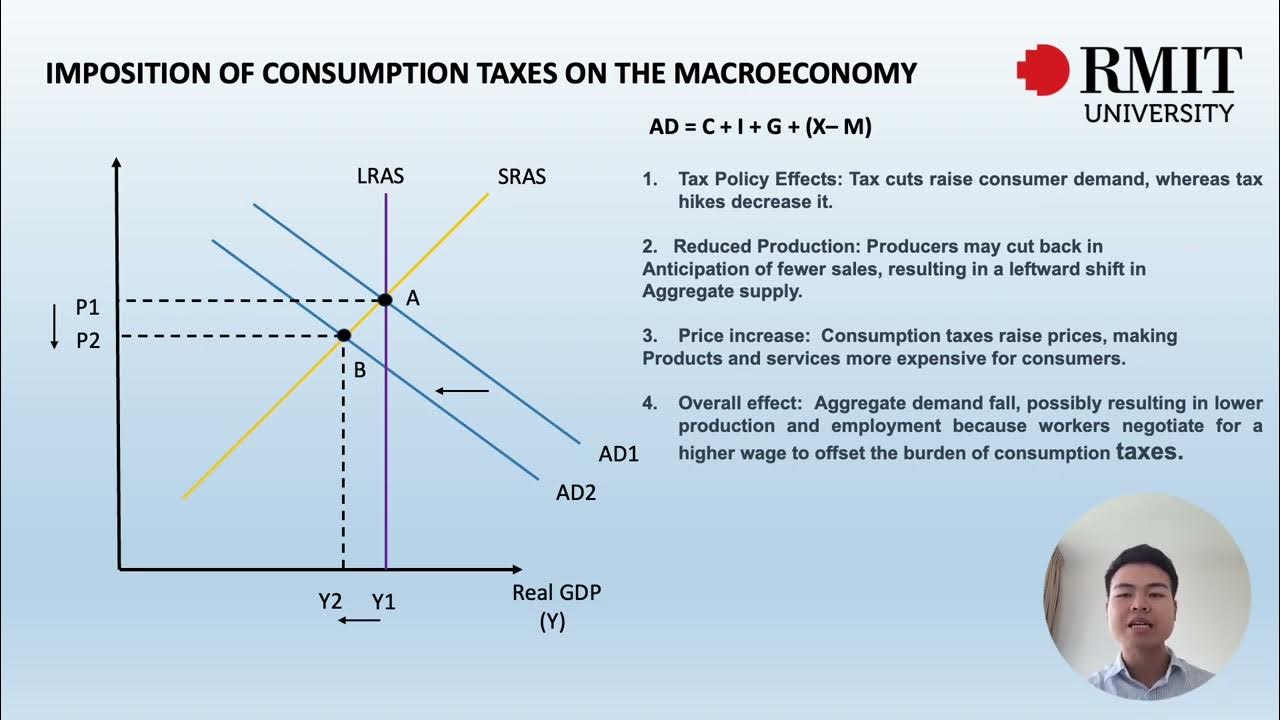
- 🔄 Consumption taxes lower aggregate demand (AD) because consumers have less disposable income, leading to a ripple effect on overall economic activity.
- 🚶♂️ Health-related taxes, such as a fat tax, may increase long-term aggregate supply (AS) by improving public health and labor productivity.
- 🏥 Healthier populations due to improved dietary habits can lower healthcare costs, boosting economic growth by increasing disposable income and consumer spending.
- 📈 A Directed Acyclic Graph (DAG) shows how a fat tax influences consumption behavior, health outcomes, and ultimately economic growth through indirect effects.
- 🎯 Public health campaigns may act as confounders in the fat tax's impact, as they influence both health outcomes and the tax's implementation.
Q & A
What is the primary focus of the presentation?
-The presentation primarily focuses on the wide-ranging effects of taxes, particularly consumption taxes and tariffs, on public health, economic growth, and government revenue.
How does a consumption tax affect consumer and producer welfare?
-A consumption tax leads to a decrease in consumer surplus due to higher prices and a reduction in the quantity supplied in the market, which impacts producer surplus. It also generates deadweight loss due to transactions that no longer occur because of the higher price.
What is the impact of a consumption tax on the supply curve?
-A consumption tax causes the supply curve to shift to the left because it raises the cost of production for producers, making them willing to supply fewer units at each price level.
How does a tariff on imports differ from a consumption tax?
-A tariff on imports is a tax imposed specifically on imported goods, which shifts the supply curve upward by the amount of the tariff, reducing consumer surplus and increasing producer surplus for domestic producers.
What is the deadweight loss caused by a tariff?
-The deadweight loss caused by a tariff is due to the reduction in the quantity of imports because of higher prices, which directly affects international trade.
How does a consumption tax influence the aggregate demand (AD) and aggregate supply (AS) model?
-A consumption tax can lead to a decrease in consumption expenditure, shifting the AD curve to the left. It typically does not have a direct impact on the AS curve in the short term, as it does not change the economy's productive capabilities.
What is the potential long-term benefit of a tax that improves public health?
-A tax that improves public health can shift the AS curve to the right, indicating an increase in the economy's productive capacity. Healthier individuals tend to be more productive, which can lead to higher levels of output or the same amount of input.
How can a healthier population result in positive externalities?
-A healthier population can lead to reduced disease transmission rates and improved public health, which can decrease healthcare-related costs and potentially increase disposable income for consumers, boosting consumer spending.
What is a Directed Acyclic Graph (DAG) and how is it used in the context of the presentation?
-A Directed Acyclic Graph (DAG) is used to represent the causal relationships between variables. In the presentation, it is used to analyze the impact of a fat tax on consumption behavior, health outcomes, and economic growth, including potential confounders like public health campaigns.
How does the fat tax policy influence consumption behavior according to the DAG?
-The fat tax policy makes unhealthy foods more expensive, potentially reducing their consumption, which is represented by an arrow leading from 'Fat Tax' to changes in 'consumption behavior' in the DAG.
What is the indirect impact of the fat tax on economic growth as presented in the DAG?
-The indirect impact of the fat tax on economic growth is represented by an arrow from 'Health outcome' to 'economic growth' in the DAG, suggesting that changes in dietary patterns can affect healthcare costs, labor force participation, and productivity, influencing overall economic performance.
Outlines
💼 Impact of Consumption Taxes on Economic Welfare
This paragraph discusses the effects of consumption taxes on consumer and producer welfare. In a market without taxes, there is an equilibrium where supply and demand intersect, creating consumer and producer surpluses. When the government imposes a tax, the supply curve shifts left due to increased production costs, leading to a reduced quantity supplied and higher prices for consumers. This results in a decrease in consumer surplus and a potential reduction in consumer welfare. The tax generates deadweight loss, representing the loss of economic welfare due to the tax, as some transactions that would have occurred without the tax no longer happen. However, the government collects tax revenue that can be used for public services and programs. The paragraph also contrasts the impact of consumption taxes with tariffs on imports, highlighting that tariffs directly affect international trade by reducing the quantity of imports and shifting the supply curve upward by the amount of the tariff.
📈 Macroeconomic Effects of Consumption Taxes
The second paragraph delves into the macroeconomic implications of consumption taxes using the AD-AS model. It explains that an increase in taxes leads to a decrease in consumer income available for spending, which in turn shifts the aggregate demand (AD) curve to the left. This reduction in consumption expenditure can trigger a multiplier effect, causing businesses to earn less and potentially reducing hiring and investment, further decreasing overall economic activity. The paragraph also notes that consumption taxes do not directly affect the aggregate supply (AS) curve in the short term, as they do not change the economy's productive capabilities. However, taxes that improve public health can have long-term benefits, potentially shifting the AS curve to the right by increasing the economy's productive capacity. Healthier individuals are more productive, leading to higher output levels and reduced healthcare costs, which can boost consumer spending and shift the AD curve to the right. The paragraph concludes with a discussion of the health and economic effects of a fat tax using Directed Acyclic Graphs (DAGs), illustrating the potential indirect impact of the tax on economic growth through changes in dietary patterns, healthcare costs, labor force participation, and productivity.
Mindmap
Keywords
💡Consumption Tax
💡Consumer Surplus
💡Producer Surplus
💡Deadweight Loss
💡Tariff
💡Aggregate Demand (AD)
💡Aggregate Supply (AS)
💡Multiplier Effect
💡Fat Tax
💡Directed Acyclic Graphs (DAG)
💡Public Health Campaigns
Highlights
Consumption taxes impact consumer and producer welfare by altering market equilibrium.
A tax imposition causes the supply curve to shift, leading to reduced quantity supplied.
Consumer surplus decreases due to higher prices resulting from taxes.
Deadweight loss occurs due to transactions not happening because of higher prices.
Government collects tax revenue that can fund public services and programs.
Tariffs on imports are a type of tax that shifts the supply curve upward.
Consumer surplus decreases as consumers pay more for imported goods due to tariffs.
Domestic producers benefit from tariffs as they can sell at higher prices.
Deadweight loss from consumption tax primarily affects domestic transactions.
Tariffs cause deadweight loss by reducing international trade quantity.
Consumption taxes can decrease aggregate demand (AD) by reducing consumer spending.
A decrease in consumption can trigger a multiplier effect, reducing overall economic activity.
Consumption taxes do not directly impact the aggregate supply (AS) in the short term.
Health-improving taxes can shift the AS curve right, indicating increased productive capacity.
Healthier individuals are more productive, leading to higher levels of output.
Healthier populations can reduce disease transmission rates and healthcare costs.
A fat tax can change consumption behavior, making unhealthy foods more expensive.
Changes in dietary habits due to a fat tax can improve public health.
Improved health outcomes can influence economic growth by affecting healthcare costs and productivity.
Public health campaigns can be a confounder, influencing both fat tax implementation and health outcomes.
Transcripts
Ladies and gentlemen, esteemed colleagues, and fellow attendees of the Australian Conference
of economists, good morning and welcome to this presentation on the topic of how such
taxes can have wide-ranging effects on public health economic growth and government revenue
so let's get started! So the first thing that I'm going to talk about is the impact of consumption
taxes on consumer and producer welfare. Initially in a market without taxes there is an equilibrium
market where the supply and demand curve intersect, so the green part over here represents
the consumer surplus and the red part over here represents the producer surplus. If the government
impose the tax which is a blue part right here the supply curve will shift to the left side this is
because the tax raises the cost of production for producer and higher cost mean producer are
willing to supply fewer unit at each price level resulting in a reduced quantity suppled in the
market. At the same time as consumer pay a higher price because of the tax, the consumer surplus
which represents the different between that they are willing to pay and what they are actually
paying will decrease, some consumer may choose not to buy the product at the higher price as
we can see both of their welfare has reduced. The consumption taxes will generate deadweight loss
the deadweight loss represents the overall loss of economic welfare in the market due to the tax,
it occurs because some transaction that would have occurred without the tax no longer happen
due to the higher price. On the positive side, the government collects tax revenue this tax revenue
can use for public services and also Government programs. Next I'll be talking about the Tariff on
Imports. The Tariff on Imports we also can start with a standard supply and demand diagram, now
a tariff means a tax that is imposed on imported goods, this line represents the import price and
it shifts the supply curve upward by the amount of tariff For example, if the government impose
tariff which cost higher price for import Goods consumer surplus will decrease because consumer
now pay more for the same quantity of imports so there will lose some welfare so the consumer
surplus is normally this big triangle right here and after the government imposed the Tariff which
is this part the triangle becomes smaller as you can see the green part represents the
Tariff revenue and and the gray part represents deadweight loss. On the other hand, domestic
producer will benefit from the Tariff because they can sell their good at higher price leads
to increase their producer surplus so normally the producer surplus is just a small triangle
right here and after the Tariff has been imposed the triangle become bigger because they can sell
their goods at a higher price so it is good for the producer. Now I'll be talking about the
difference between deadweight loss in consumption tax and tariff so in the case of a consumption
tax the Deadweight loss is caused by reduced consumption due to the higher price leading to
less quantity demanded and supply in the market and it primally affects the domestic transactions
and may not necessarily reduce the quantity traded in international market conversely in the case of
a tariff the deadweight loss is caused by the reduction in the quantity of imports due to the
higher price which reduces International Trade so the Tariff directly affects International Trade by
reducing the quantity of imports. Alright moving to the next one I'll be talking about the impact
of consumption taxes on the macroeconomy using AD and AS model so aggregate demand (AD) represents
the total demand for good and services in an economy while, aggregate supply (AS) represents
the total quantity of good and services that producers in an economy are willing and able to
supply at different price levels. For example, when consumer pay more in taxes they have less
income available for spending, this leads to a decrease in consumption expenditure so a
decrease in consumption due to a higher taxes will shift the aggregate demand (AD) curve to the left
side this is because consumption is a significant component of aggregate demand (AD)and a reduction
in consumer spending reduces the overall demand for goods and services in the economy. Well
therefore the decrease in consumption can also trigger a multiplier effect, so when consumer
spend less businesses earn less revenue which can lead to reduce hiring and investment by businesses
this can further decrease overall economic activity and contributing a larger decrease
in AD and with the consumption taxes typically do not have a direct impact on the aggregate supply
curve in the short term because aggregate supply (AS) represents the productive capacity of the
economy and taxes on consumption do not change the economy's productive capabilities. Furthermore,
the tax that improve people health can have potential long-term benefit for the economy
however a tax that improve people health is likely to shift the aggregate supply (AS) curve to the
right indicating an increase in the economy's productive capacity this shift represents an
improvement in the potential output of the economy over the long term. For example,
healthier individuals tend to be more productive at work they have lower absenteeism rate,
higher labor force participation and increase on-the-job efficiency this leads to higher levels
of output or the same amount of input. Moreover, a healthier population can also result in positive
externalities such as reduce disease transmission rates and improve Public Health this can lead to a
decrease in health care related costs so if the health care cost is reduced due to the improved
health may lead to increase disposable income for consumers this could potentially boost consumer
spending on other goods and services well this shift the aggregate demand (AD) curve to the right
side so in this final part I'm going to talk about the health and economy effects of a fat tax using
Directed Acyclic Graphs (DAG) so at the starting point of the graph I introduced the fat tax policy
this is the primary intervention we are analyzing and this is the cost of changes in subsequent
variables moving from left to right we see an arrow from "Fat Tax" leading to changes in the
"consumption behavior" of consuming unhealthy food the arrow implies that the tax impacts consumer
behavior, making unhealthy Foods more expensive and potentially reducing their consumption.
Another set of error extend from "consumption behavior" to "health outcome" those indicate a
direct causal relationship suggesting that changes in dietary habits influence health outcome,
consuming fewer unhealthy Foods is linked to improve Public Health potentially reducing health
issues like obesity you know diabetes and other diet related conditions. Additionally there is an
arrow from "Health outcome" leading to "economic growth" this arrow represents an an indirect
impact of the fat tax on economic growth changes in dietary patterns can affect health care cost,
labor force participation and productivity which, in turn, can influence the overall
economic performance of a region or a country. Well, now I introduce a potential confounder
which is public health campaigns represented by an arrow that connects with both the fat
tax and health outcome. This signifies that public health campaigns aim at improving
dietary choices and promoting healthy lifestyles could influence both the implementation of the
"fat tax" and the "health outcomes" well ladies and gentlemen that is all for my presentation,
thank you all for listening and I hope that you all are interested in this economy related topic.
関連動画をさらに表示
RMIT University, Understanding the Business Environment, Assessment 3: Presentation
Chapter 6 Exercises 7-11. Supply, Demand, and Government Policies.
Taxes: Crash Course Economics #31
Incidence of Taxation - How to Graph It
Y1 30) Fiscal Policy - Government Spending and Taxation
Economic Update: How Deficits and Debts Rip Us Off
5.0 / 5 (0 votes)