How to Calculate a Correlation (and P-Value) in Microsoft Excel
Summary
TLDRThis video tutorial demonstrates how to calculate the significance of a correlation coefficient in Microsoft Excel, which doesn't provide p-values directly through its correlation function. The workaround involves using the regression tool to obtain the p-value. The presenter guides viewers through selecting the correct ranges for input Y and input X, running the regression, and finding the p-value from the ANOVA table. The video concludes with a discussion on interpreting the p-value to determine the statistical significance of the correlation between hours studied and exam grades.
Takeaways
- 😕 Microsoft Excel's Data Analysis Toolpak does not provide a p-value for correlation analysis, making it difficult to assess statistical significance.
- 🔍 A workaround is to use regression analysis in Excel to obtain the p-value, which helps determine the significance of the correlation.
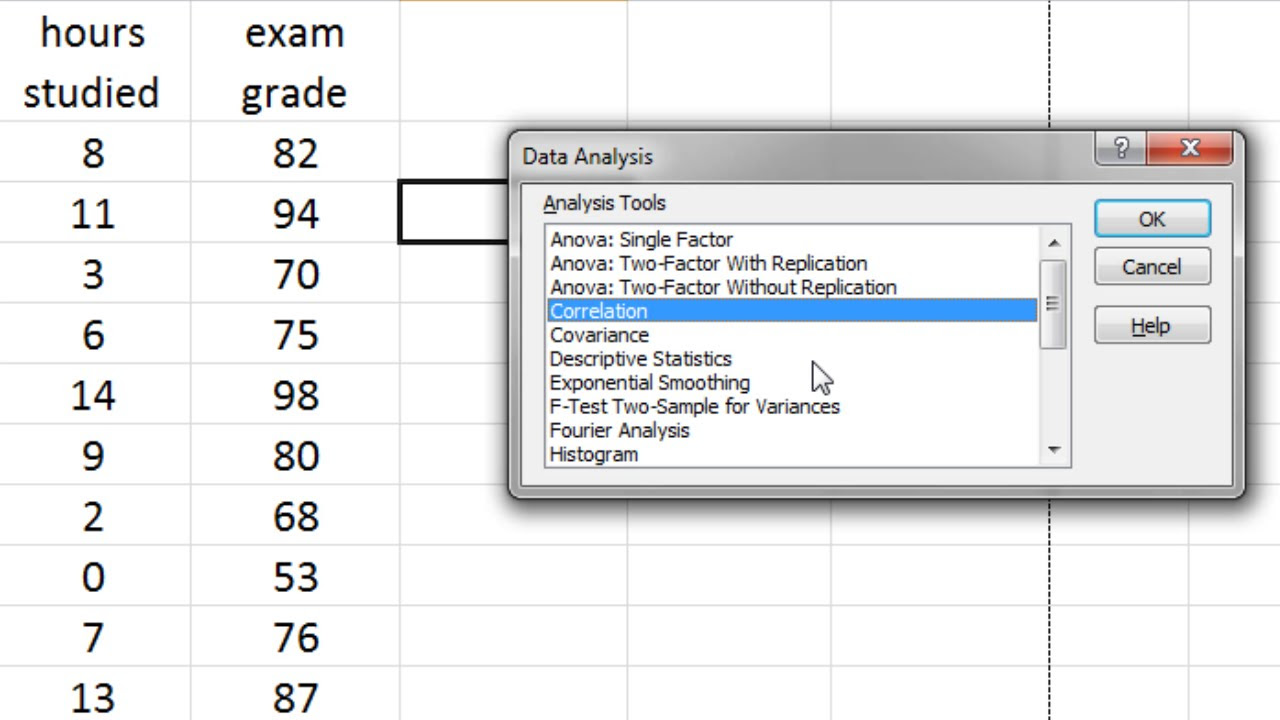
- 📊 For input Y range, select the dependent variable (exam grades), and for input X range, select the independent variable (hours studied), including their labels.
- 📈 In a simple regression with two variables, the multiple R value is equivalent to the Pearson correlation coefficient (r).
- 📉 The p-value can be found in the ANOVA table under 'significance' and is also identical to the p-value under the independent variable in the regression output.
- 🔑 An alpha level of 0.05 is used as the threshold for statistical significance; if the p-value is less than 0.05, the correlation is considered significant.
- 📝 The script demonstrates that a correlation coefficient of .86 is statistically significant, indicating a strong positive relationship between study hours and exam grades.
- 📋 The results are reported with the Pearson's r value, degrees of freedom (df = N - 2), and the p-value (less than .001 or less than .05, depending on the context).
- 📖 The video concludes by showing how to interpret and report the p-value in the context of a correlation analysis using Excel's Data Analysis Toolpak.
Q & A
What is the issue with using Microsoft Excel's Data Analysis Toolpak to calculate correlation?
-The issue is that it does not provide a p-value, which is necessary to assess whether the correlation is statistically significant.
How can we obtain a p-value for correlation in Excel?
-We can obtain a p-value by using the regression feature in Excel, as it provides a p-value that can be used to assess the statistical significance of the correlation.
What are the two boxes in the regression input that need to be filled out?
-The two boxes are 'Input Y range' for the dependent variable and 'Input X range' for the independent variable.
Why is it important to include the variable names when selecting the ranges for regression in Excel?
-Including the variable names ensures that the correct data is being analyzed and helps in interpreting the results accurately.
What is the relationship between 'Multiple R' and 'Pearson r' when there are only two variables?
-When there are only two variables, 'Multiple R' is identical to 'Pearson r', indicating the correlation between the two variables.
Where can the p-value be found in the regression output in Excel?
-The p-value can be found in the ANOVA table under 'significance' and also under the 'p-value' for the independent variable in the regression output.
What is the decision rule for determining statistical significance when using an alpha of .05?
-If the p-value is less than .05, the correlation is considered statistically significant.
What does a p-value of .0001 indicate about the correlation between hours studied and exam grades?
-A p-value of .0001 indicates that there is a statistically significant positive relationship between hours studied and exam grades.
How is the degrees of freedom (df) calculated in this context?
-The degrees of freedom (df) is calculated as N minus 2, where N is the number of observations.
Why is it acceptable to report 'p < .05' even if the actual p-value is less than .001?
-Reporting 'p < .05' is acceptable because the alpha level used for the test is .05, and any p-value below this threshold indicates statistical significance.
What is the practical limit for reporting p-values in written results?
-The practical limit for reporting p-values is typically 'less than .001', as p-values usually do not get reported smaller than this value.
Outlines
📊 Obtaining the Significance of Correlation in Excel
This paragraph discusses the process of determining if a correlation is statistically significant in Microsoft Excel. It explains that while Excel's Data Analysis Toolpak can calculate the correlation coefficient, it does not provide a p-value to assess significance. To overcome this, the speaker suggests using the regression tool instead. The steps include selecting the exam grade values as the input Y range and the hours studied as the input X range, ensuring to include variable names. The output from the regression analysis reveals the p-value, which is crucial for determining statistical significance. The paragraph highlights that with an alpha level of 0.05, a p-value less than this threshold indicates a significant correlation. The example provided shows a significant positive relationship between hours studied and exam grades, with a Pearson's r of 0.86 and a p-value much less than 0.05.
🔚 Conclusion on Correlation Coefficient Significance
The final paragraph of the video script concludes the tutorial on how to obtain the p-value for the correlation coefficient using Microsoft Excel's Data Analysis Toolpak. It summarizes the process and the significance of the findings, reinforcing the importance of the p-value in statistical analysis. The paragraph effectively wraps up the tutorial, providing a clear conclusion to the audience.
Mindmap
Keywords
💡Correlation
💡Significance
💡p-value
💡Regression
💡Pearson's r
💡ANOVA table
💡Multiple R
💡Alpha level (α)
💡Degrees of freedom (df)
💡Data Analysis Toolpak
Highlights
In Microsoft Excel, the Data Analysis toolpak does not provide a p-value for correlation.
A workaround is to use regression analysis to obtain a p-value.
Select 'Input Y range' for the dependent variable, such as exam grades.
Select 'Input X range' for the independent variable, like hours studied.
Ensure to select the variable names if they are included in the data set.
Regression analysis provides a p-value under the ANOVA table.
With two variables, the multiple R is identical to the Pearson r.
The p-value for the correlation can be found under 'Significance F' or 'p-value'.
A p-value less than .05 indicates a statistically significant correlation.
A correlation coefficient of .86 is significant, showing a positive relationship.
The results can be written as a significant positive relationship with r(11) = .86 and p < .001.
The degrees of freedom (df) are calculated as N - 2, where N is the sample size.
A more informative p-value is provided, which is less than .001.
The p-value reported is usually not smaller than less than .001 in written results.
This method concludes how to obtain the p-value for the correlation coefficient in Excel.
Transcripts
In our last video, we went ahead and calculated the correlation on these
values,
but we didn't get a significance value for the correlation to see whether it
was statistically significant or not.
And unfortunately in Microsoft Excel, when we run the correlation procedure through
the data analysis toolpak it does not give us a p-value,
so we can't assess whether a given correlation is statistically significant
or not. But thankfully there is a work- around here and what we need to do is if
we go to regression, and select that, we can obtain a p-value this way.
Now what we'll do is - notice there's two boxes here - input Y range and input X
range;
for input Y range we'll go ahead and select the exam grade values and I'm
also going to select the label or the variable name in the first row here,
exam grade.
Next click in the input X range box here and then select hours studied and all the
values there and then be sure if you do select the variable names as I have here
be sure to select labels. Okay that looks good,
let's go ahead and click OK. And then here we get our output; I'm going to
expand this a little bit just to the values we need there's a lot of
information here but I really only need a few values and let's go ahead and
highlight those here.
First of all let's make this font a little bit bigger, so it's easier to read.
All right and then we'll expand what we need here. Now first of all if you watched
the last video on obtaining a correlation under where it says multiple
R in regression
if we have just two variables, like we do in this correlation example where we
have hours studied and exam grade then with two variables the multiple R is
just identical to the Pearson r. So notice how this is also once again
.86.
So we could
really just run regression to get our correlation if you look under multiple
R here. Now for the p-value what we want to do is we can go to the ANOVA
table and under significance here this is our p-value and it is very small
there. Now just in case you're interested there's also the exact same p-value when
we have just two variables also is located under hours studied where it says p
value.
So notice how these two are the exact same here significance F
and p-value; they're identical. Now what we're going to do here is we'll use alpha
of .05
and the decision rule is as follows: if our p-value, as given by the significance F,
or p-value right here
if it's less than .05, then the correlation is statistically
significant
and since .0001 is definitely less than .05,
that indicates the correlation is in fact significant.
Since
this correlation coefficient of .86 is statistically significant,
that means that there is a significant positive relationship between hours
studied and the grade on the exam. And we can go ahead and write these results as
follows:
There is a significant positive relationship between the number of hours
spent studying and the grade on the exam and then I have r, and that's for
pearson's r, 11, and that's equal to the degrees of freedom, where df is equal to N
minus 2 and N is equal to 13, so 13-2 is 11.
So
r(11) equals .86 and that was the value of Pearson's r if you remember. And I put p is less
than .001. Now, alternatively, you could put p is less
than .05 if you wanted to.
Now this p-value gives us more information it is more informative than
the p-value of less than .05. But since we used an alpha of point zero
five in this test, it would be acceptable to put p is less than .05 if
we wanted to, but this does provide more information. And the reason why I said p
is less than .001, is because if you look back at our window in Excel
in our output
this value is less than .001 as it goes to four decimal places
before the one appears, but it's not less than point .0001.
In any event, in most cases when you see a p-value reported like this
it usually doesn't get smaller than less than .001; that's about
the limit where we report it in our written results.
This concludes the video on obtaining the p-value for the correlation
coefficient using the Data Analysis Toolpak in Microsoft Excel.
5.0 / 5 (0 votes)