Types of Data: Nominal, Ordinal, Interval/Ratio - Statistics Help
Summary
TLDRThis script explores the fundamental types of data in statistical analysis: Nominal, Ordinal, and Interval/Ratio. It explains how each type affects the choice of summary statistics and graphical representation, using the example of a questionnaire about choconutties. Nominal data, like chocolate preference, is best shown in pie or bar charts, while ordinal data, such as satisfaction levels, should be ordered in column charts. Interval/Ratio data, including age and spending, offers the most versatility for analysis and is effectively displayed in bar charts, histograms, or line charts.
Takeaways
- 📊 Data is central to statistical analysis and is collected to learn more about a phenomenon or process.
- 👥 Each thing data is collected about is called an observation, which could be a person, business, product, or period in time.
- 📈 Variables record the measurements of interest, such as age, sex, or chocolate preference, and are stored in rows and columns within a spreadsheet.
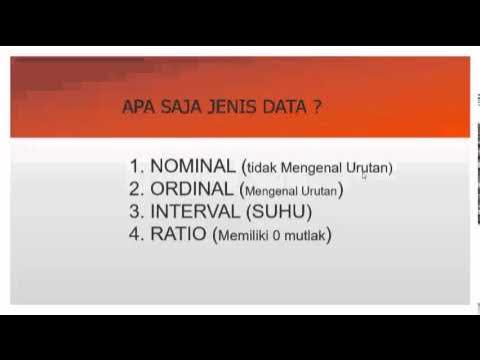
- 🔢 The level of measurement used (Nominal, Ordinal, Interval/Ratio) determines the appropriate summary statistics, graphs, and analysis.
- 🏷️ Nominal data, also known as categorical or qualitative, includes labels without a sense of order, like sex or preferred chocolate type.
- 📏 Ordinal data has a meaningful order but unequal intervals between values, such as ranks or satisfaction levels.
- 📉 Interval/Ratio data is the most precise level, including measurable quantities like age, weight, or number of customers, and can be either discrete or continuous.
- 📊 The representation of data in graphs or charts depends on the level of measurement, with specific guidelines for each type.
- 🍫 In a practical example, Helen collects customer data on various variables, including nominal, ordinal, and interval/ratio data, and analyzes them using appropriate charts and summary statistics.
- 🔍 The type of analysis performed on a dataset should be based on the level of measurement of the variables.
Q & A
What is the purpose of collecting data in statistical analysis?
-The purpose of collecting data in statistical analysis is to find out more about a phenomenon or process by collecting several measures on each person or thing of interest.
What is an observation in the context of data collection?
-An observation is each thing we collect data about, which could be a person, a business, a product, or a period in time such as a week.
What is a variable in data collection?
-A variable is a characteristic or measurement that is recorded for each observation, such as age, sex, and chocolate preference.
How is data typically organized in a spreadsheet or database?
-In a spreadsheet or database, each row corresponds to a single observation, and each column represents a variable.
What is the Nominal level of measurement?
-The Nominal level is the most basic level of measurement, also known as categorical or qualitative, and includes variables like sex and preferred type of chocolate with no sense of order.
How can nominal data be summarized?
-Nominal data can be summarized using frequency or percentage, but you cannot calculate a mean or average value for it.
What is the difference between ordinal and nominal data?
-Ordinal data has a meaningful order, unlike nominal data, but the intervals between the values may not be equal. Examples include rank and satisfaction.
Is it appropriate to calculate a mean for ordinal data?
-While some argue against calculating a mean for ordinal data, it is common practice in research, especially regarding people's behavior, but one should be cautious and consider the implications.
What is the most precise level of measurement and what does it include?
-The most precise level of measurement is interval/ratio, which includes measurable quantities like the number of customers, weight, age, and size.
What are the common summary measures for interval/ratio data?
-The most common summary measures for interval/ratio data are the mean, the median, and the standard deviation.
How should different levels of data be represented graphically?
-Nominal data can be displayed as pie charts, column or bar charts. Ordinal data is best shown as a column or bar chart. Interval/ratio data is represented as bar charts, histograms, or line charts.
In the example of Helen's choconutties, what type of data is the customer's age and how should it be represented?
-The customer's age is interval/ratio data and can be represented on bar charts or histograms.
What is the significance of the mean age of Helen's customers in the sample?
-The mean age of 38 years for Helen's customers in the sample provides a meaningful summary statistic that can be used for further analysis or marketing strategies.
Outlines

このセクションは有料ユーザー限定です。 アクセスするには、アップグレードをお願いします。
今すぐアップグレードMindmap

このセクションは有料ユーザー限定です。 アクセスするには、アップグレードをお願いします。
今すぐアップグレードKeywords

このセクションは有料ユーザー限定です。 アクセスするには、アップグレードをお願いします。
今すぐアップグレードHighlights

このセクションは有料ユーザー限定です。 アクセスするには、アップグレードをお願いします。
今すぐアップグレードTranscripts

このセクションは有料ユーザー限定です。 アクセスするには、アップグレードをお願いします。
今すぐアップグレード関連動画をさらに表示

Nominal, Ordinal, Interval & Ratio Data: Simple Explanation With Examples

Scales of Measurement: Nominal, Ordinal, Interval and Ratio Scale

statistika dasar | pengantar statistik

Pertemuan 5 - Statistik - Prof. DR. H. Budi Santoso, MSc, APU

Types of Data in Statistics - Nominal, Ordinal, Interval, and Ratio

Scales of Measurement - Nominal, Ordinal, Interval, & Ratio Scale Data
5.0 / 5 (0 votes)
